
Date: 19 June 2026
Tag: sPH-CONF-JET-2026-02
Document: Conference Note
(Back to sPHENIX Public Results page.)
Figure 1 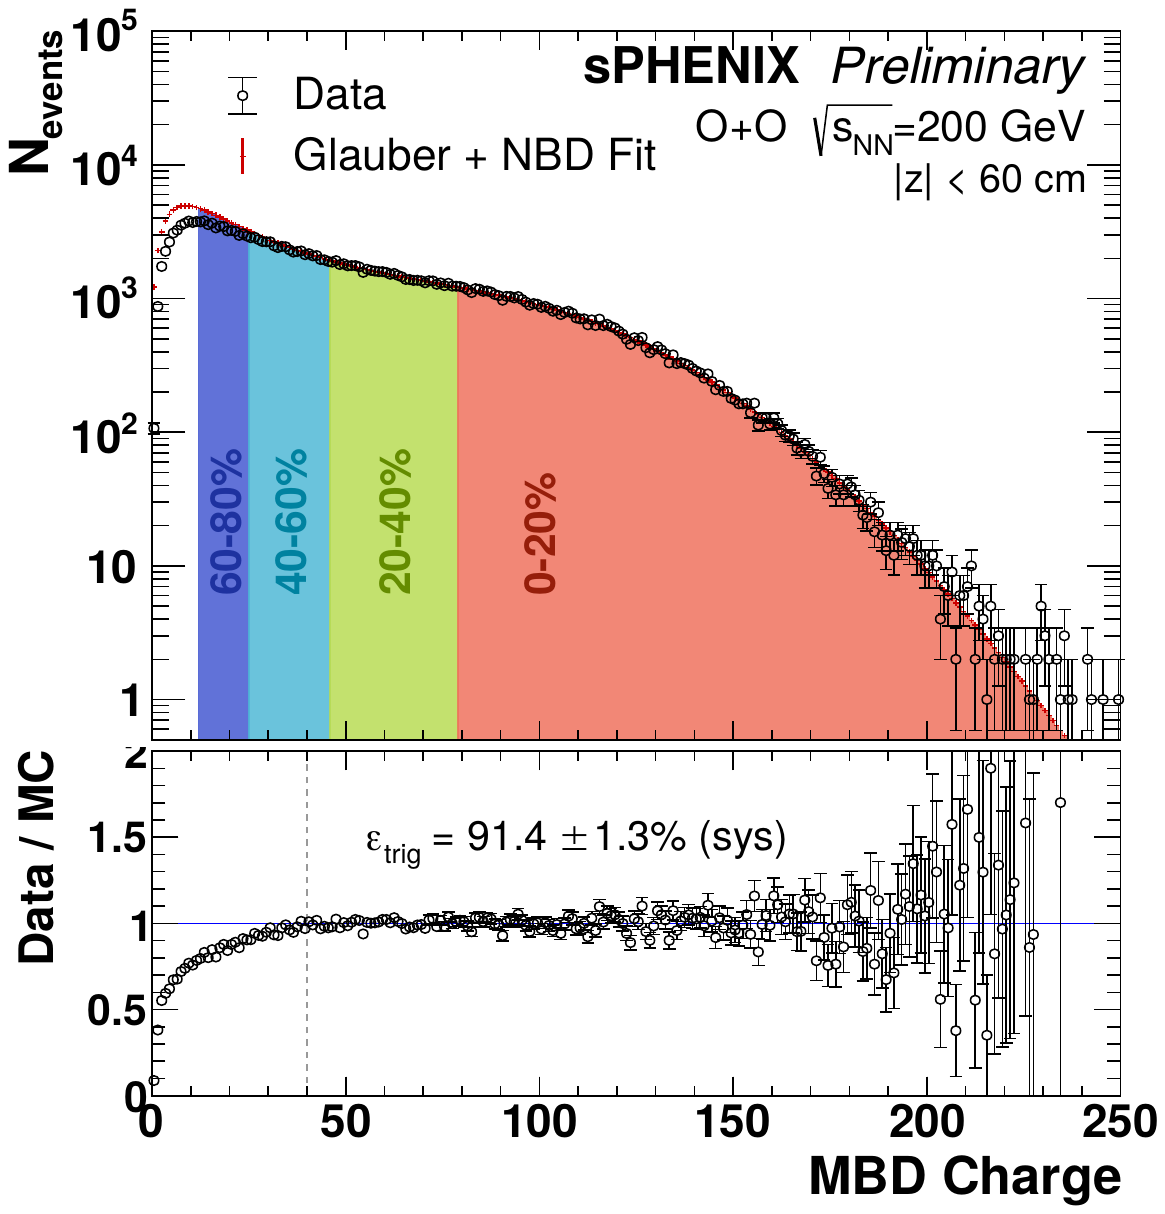
Distribution of the MBD charge sum in minimum-bias O+O collisions at √sNN = 200 GeV (points), compared to the best fit of the MC Glauber ⊕ NBD model (red line). The lower panel shows the data-to-fit ratio, with εtrig representing the minimum-bias trigger efficiency. The dashed vertical line in the bottom panel indicates the MBD charge sum value above which the data are fully efficient. |
Figure 2 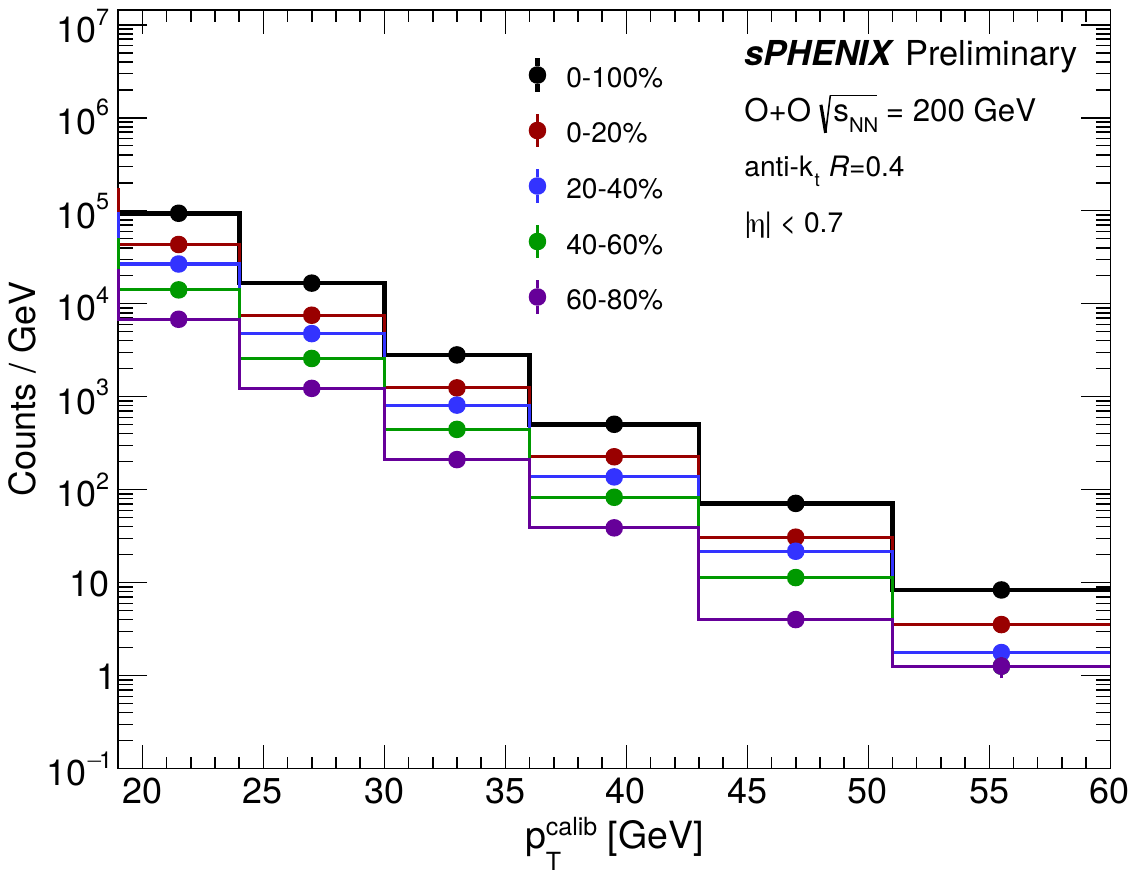
Raw jet pT spectra in O+O collisions at √sNN = 200 GeV, after background rejection, for centrality intervals of 0–20%, 20–40%, 40–60%, 60–80%, and 0–100%. The spectra are given as counts normalized by the pTcalib bin width. |
Figure 3 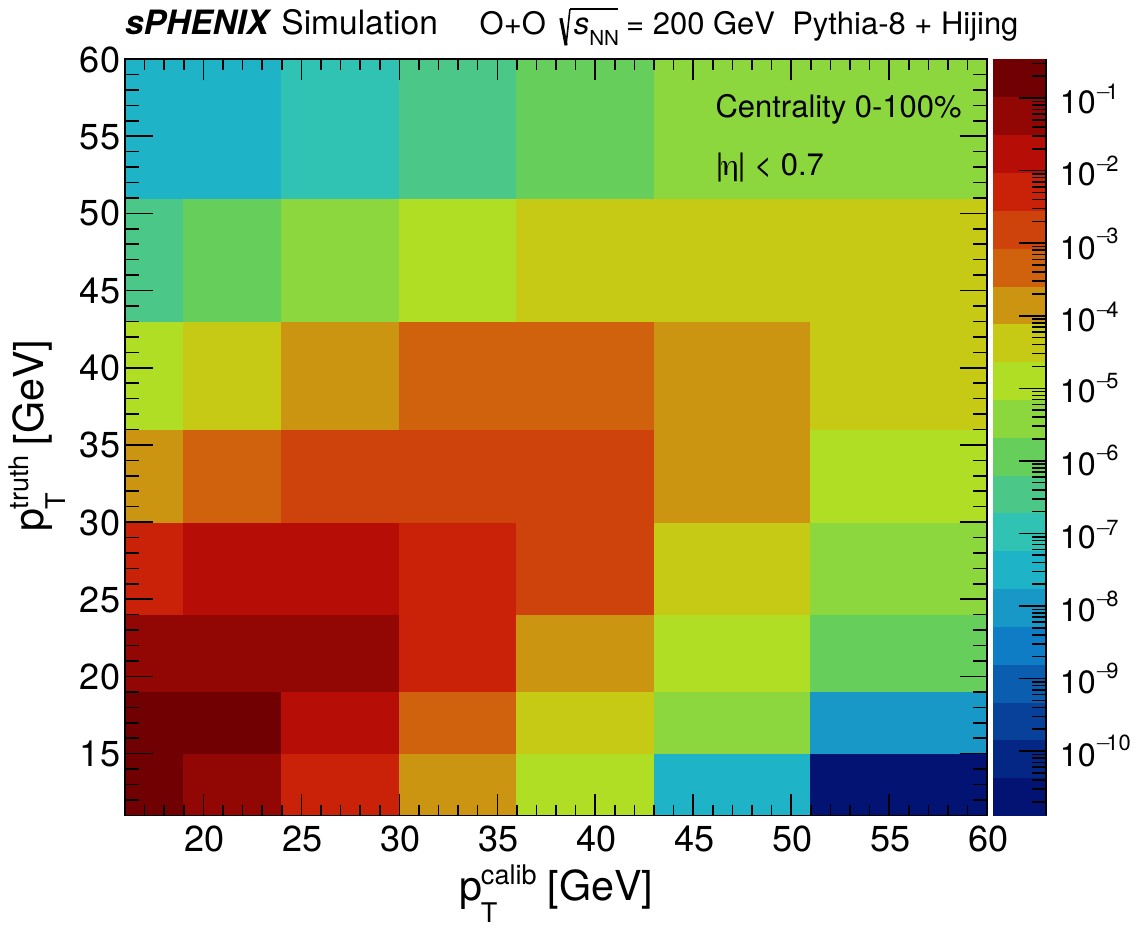
Response matrix for reconstructed and truth jets in O+O collisions from PYTHIA-8 + HIJING MC simulation for the centrality interval of 0–100%. |
Figure 4 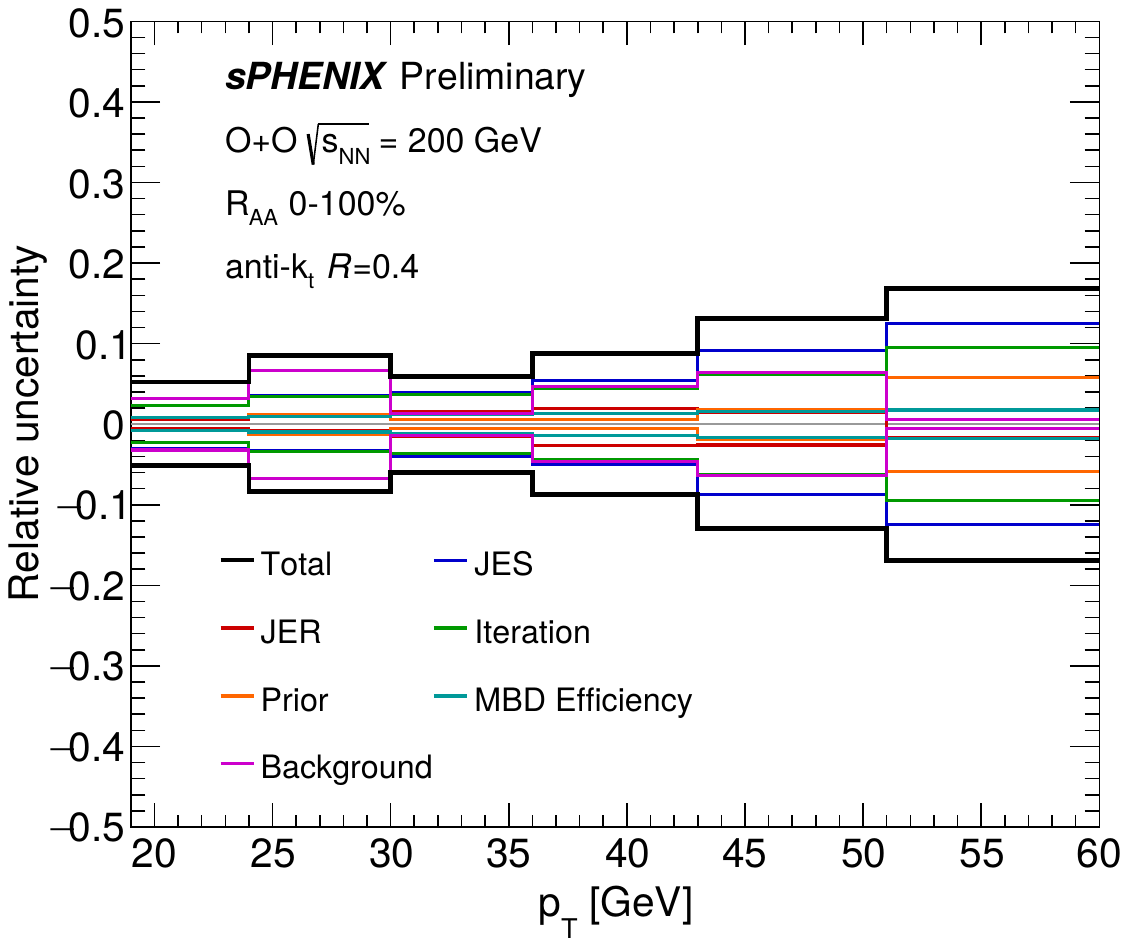
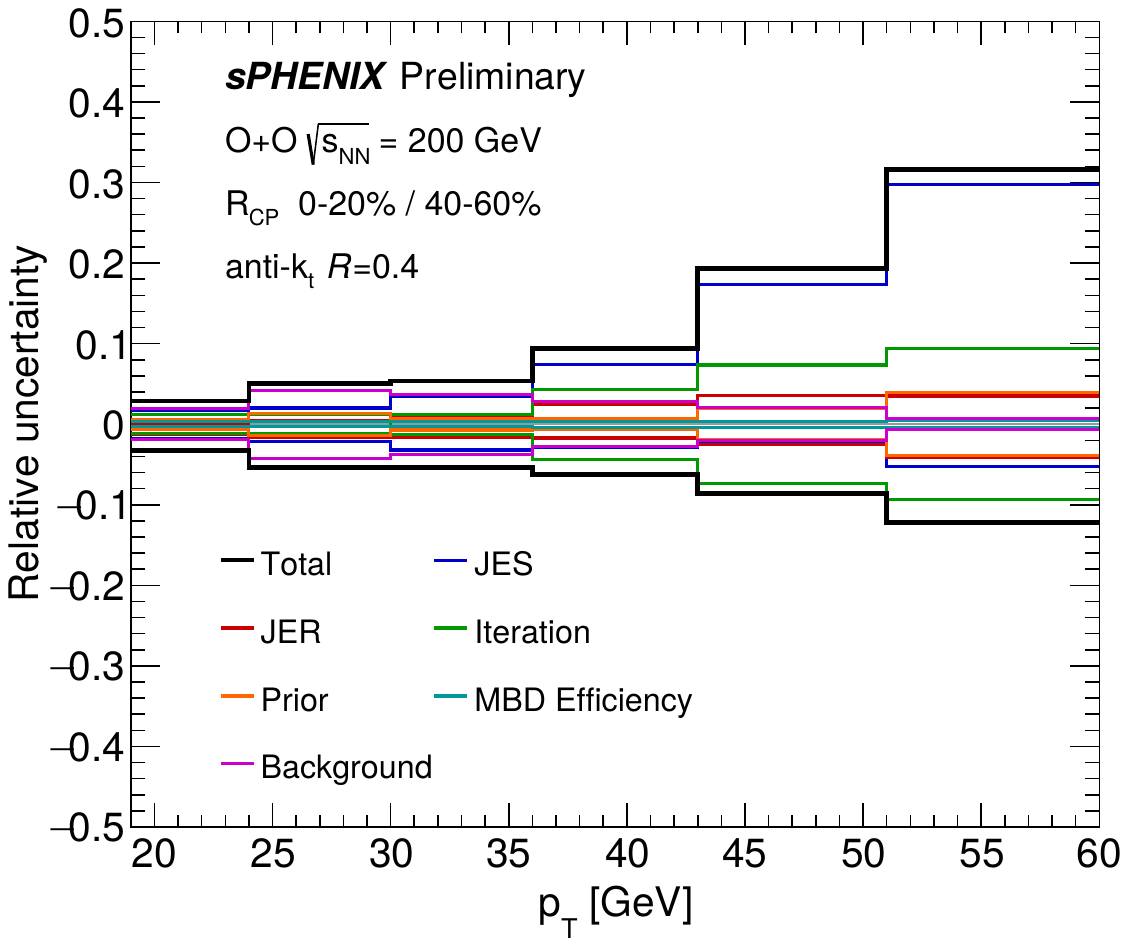
Summary of the systematic uncertainties on RAA (left) and RCP (right) as a function of jet pT for the 0–100% and 0–20%/40–60% centrality intervals, respectively. The colored curves represent the individual sources and the black curve corresponds to the total systematic uncertainty. |
Figure 5 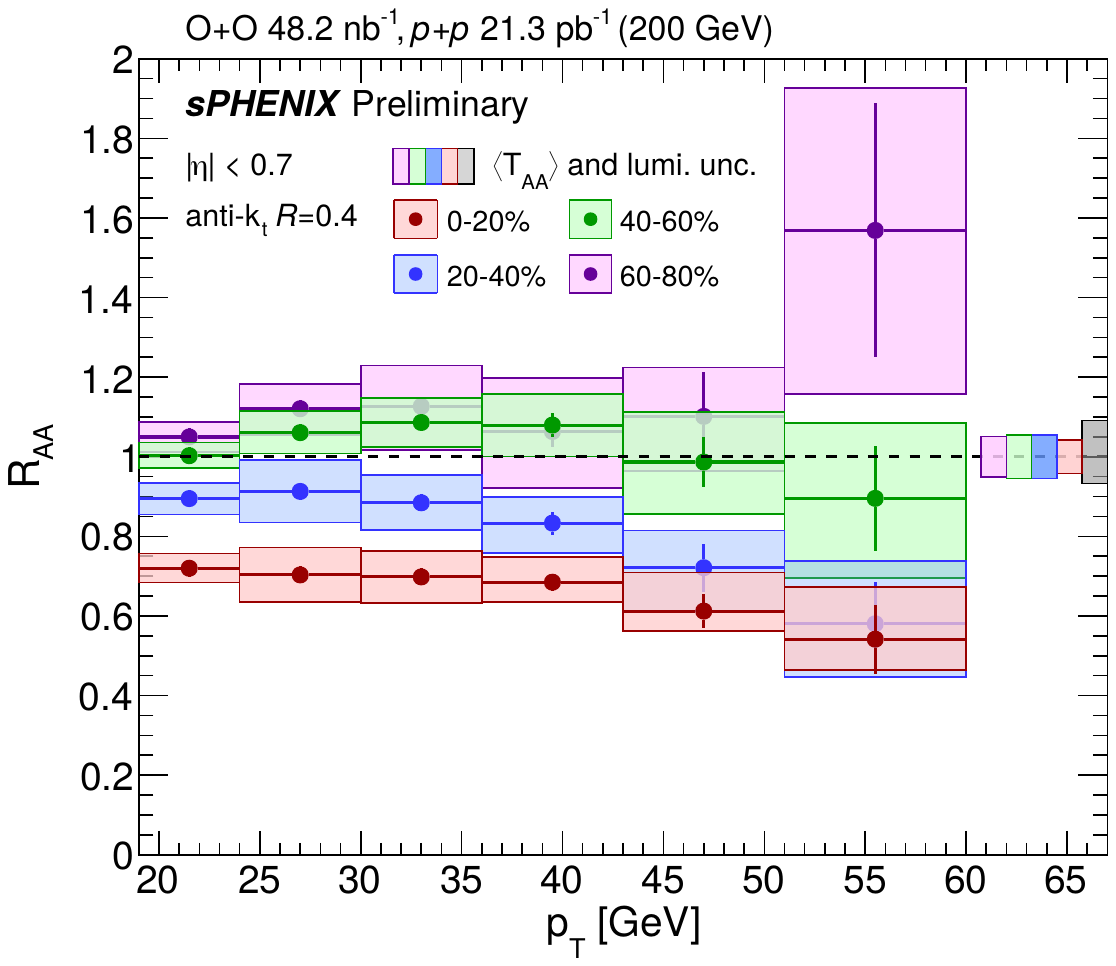
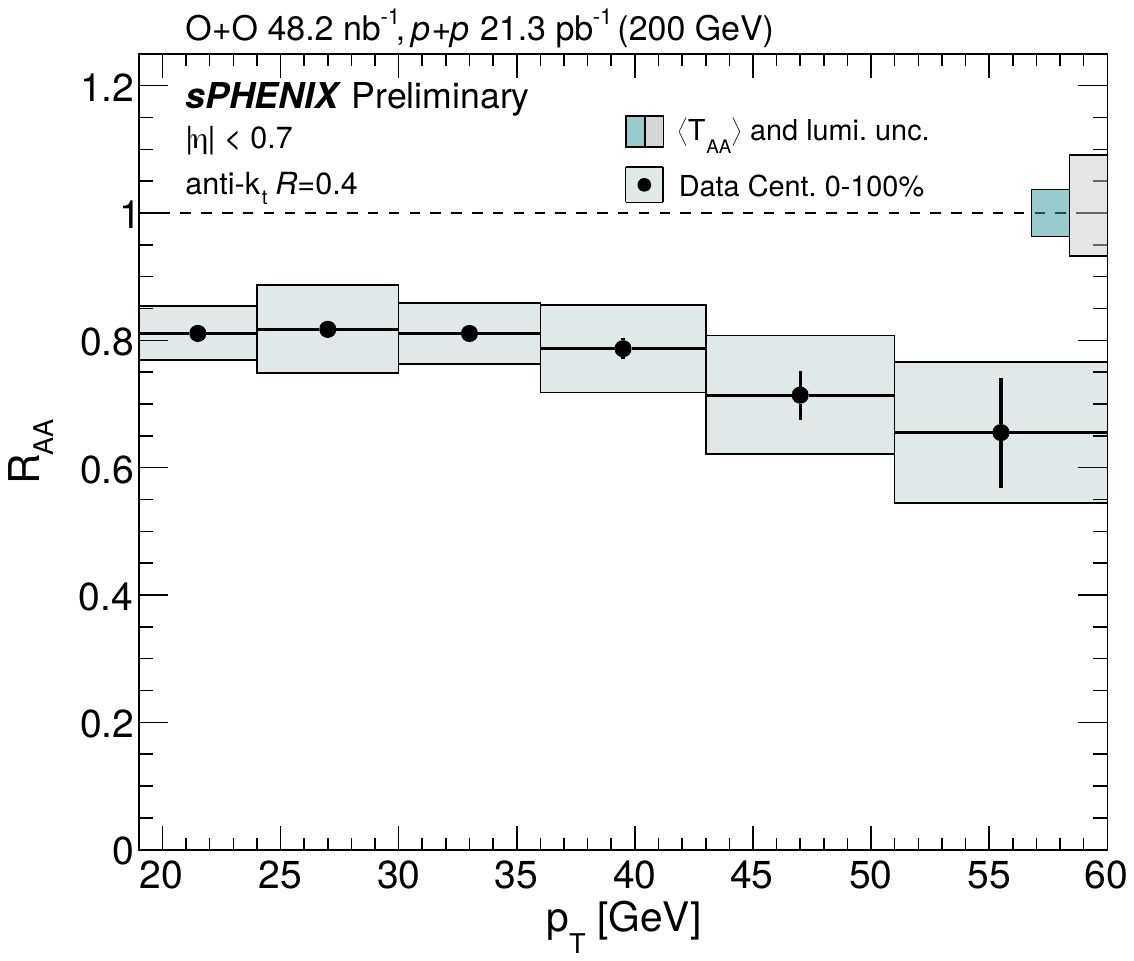
Jet RAA as a function of jet pT for O+O collisions at √sNN = 200 GeV in the 0–20%, 20–40%, 40–60%, and 60–80% centrality intervals (left) and in the inclusive 0–100% interval (right). The vertical lines and boxes represent the statistical and systematic uncertainties, respectively. |
Figure 6 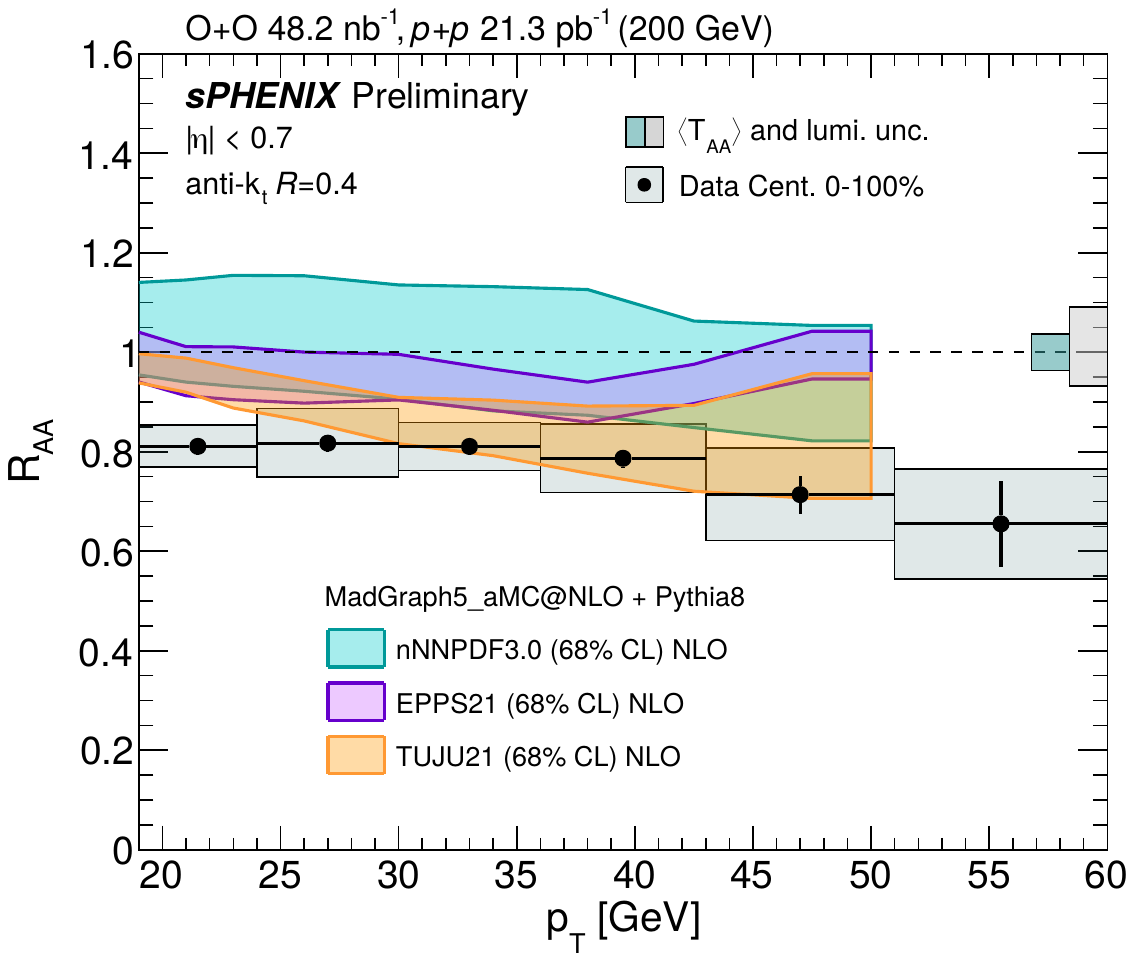
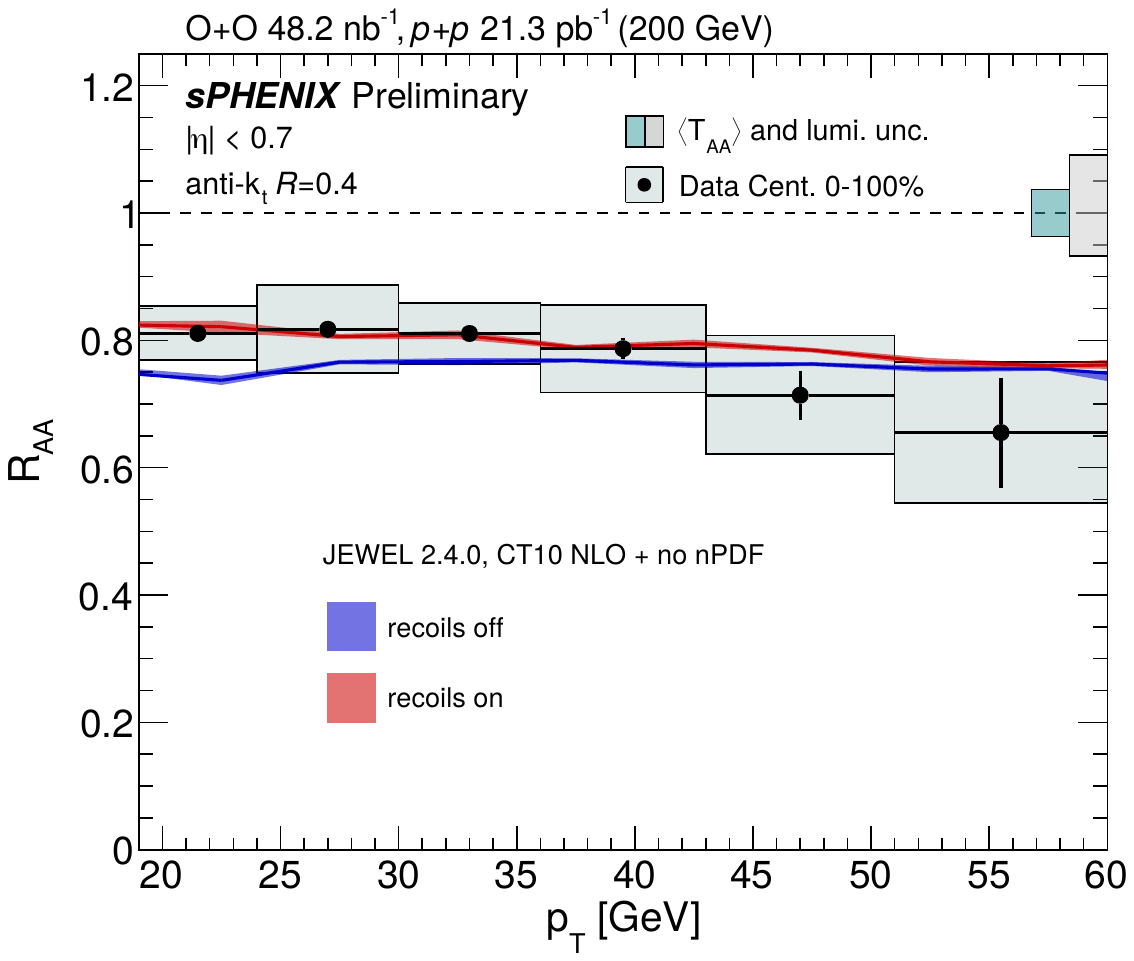
Jet RAA as a function of jet pT for O+O collisions at √sNN = 200 GeV in the 0–100% centrality intervals compared to baseline calculations with three nPDFs (left) and to predictions from JEWEL (right). The vertical lines and boxes represent the statistical and systematic uncertainties, respectively. |
Figure 7 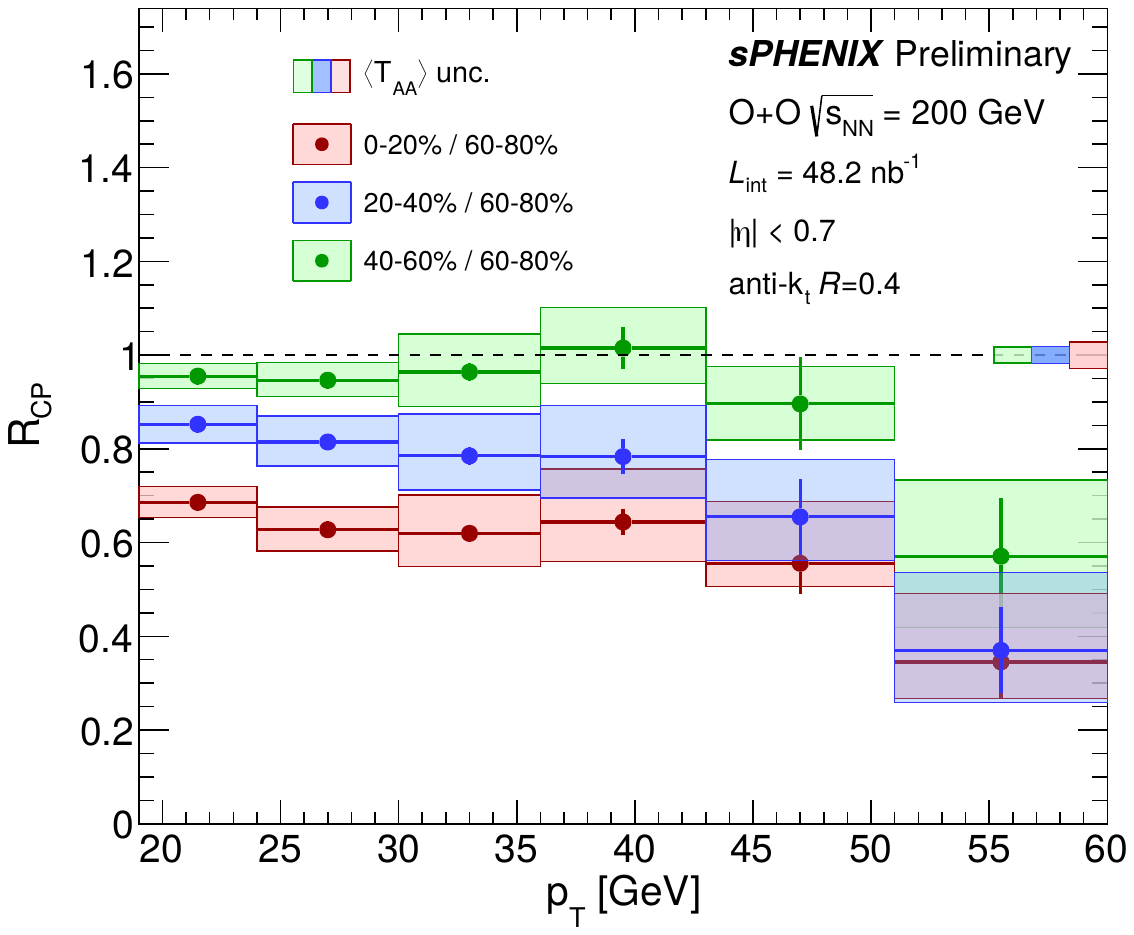
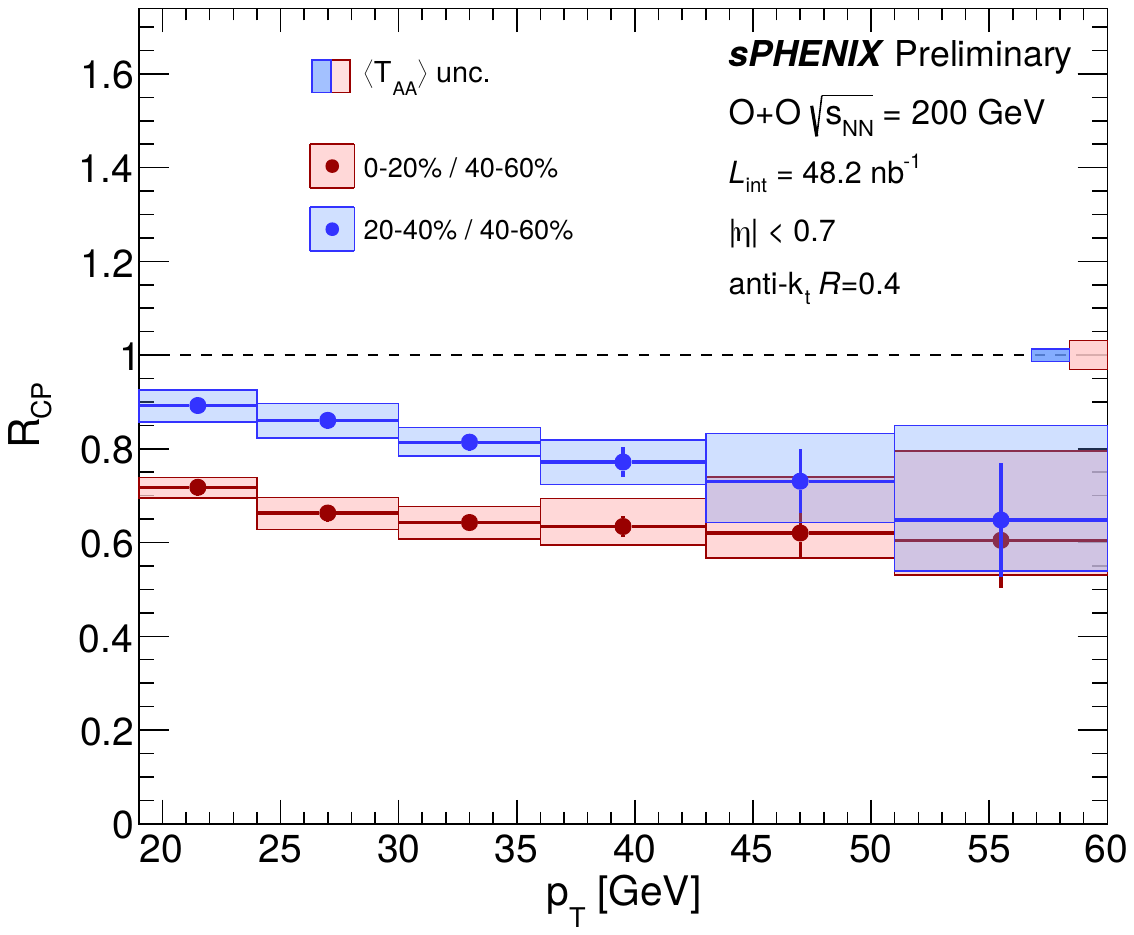
Jet RCP as a function of jet pT for O+O collisions at √sNN = 200 GeV, with the peripheral reference taken as the 60–80% centrality interval (left) and the 40–60% centrality interval (right). The red, blue, and green colors correspond to the selected centrality interval 0–20%, 20–40%, and 40–60%. The vertical lines and boxes represent the statistical and systematic uncertainties, respectively. The boxes at unity show the systematic uncertainties for the Ncoll values. |
Figure 8 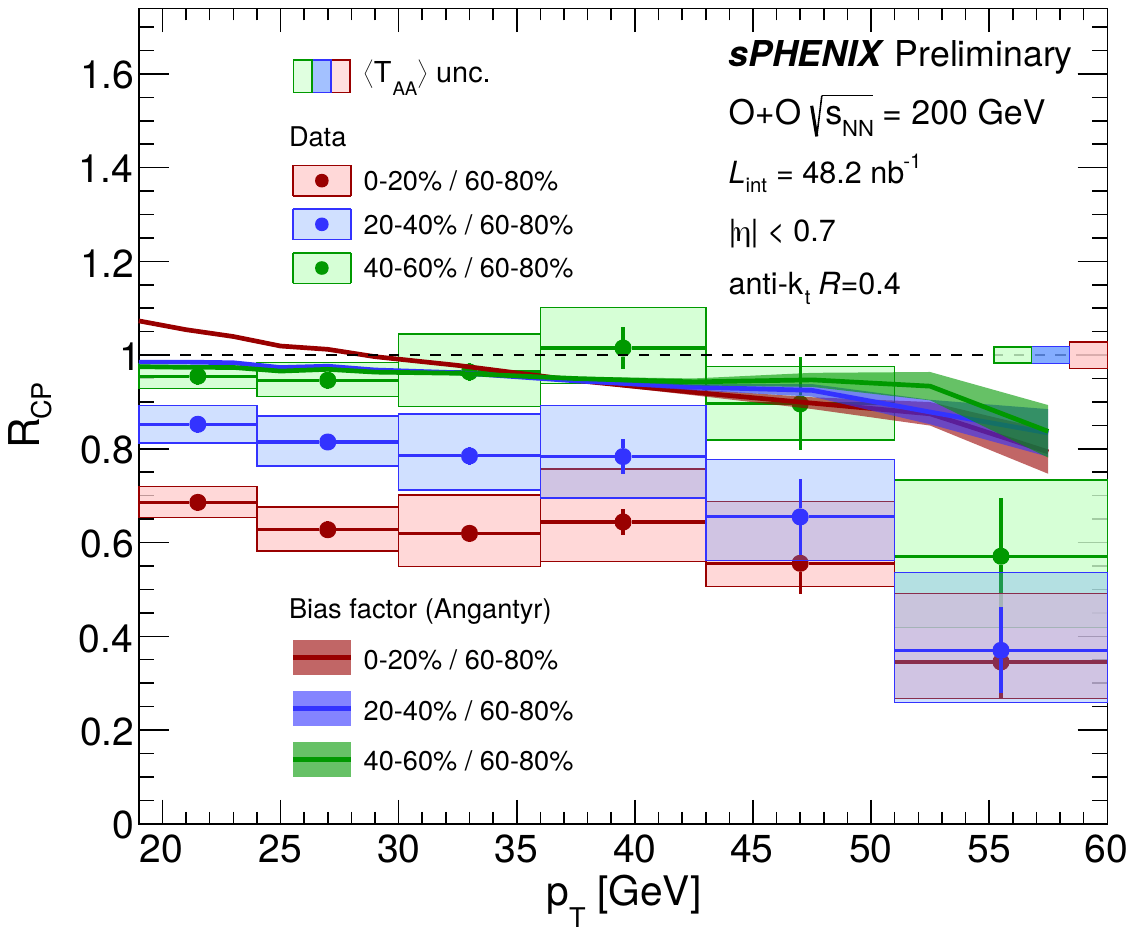
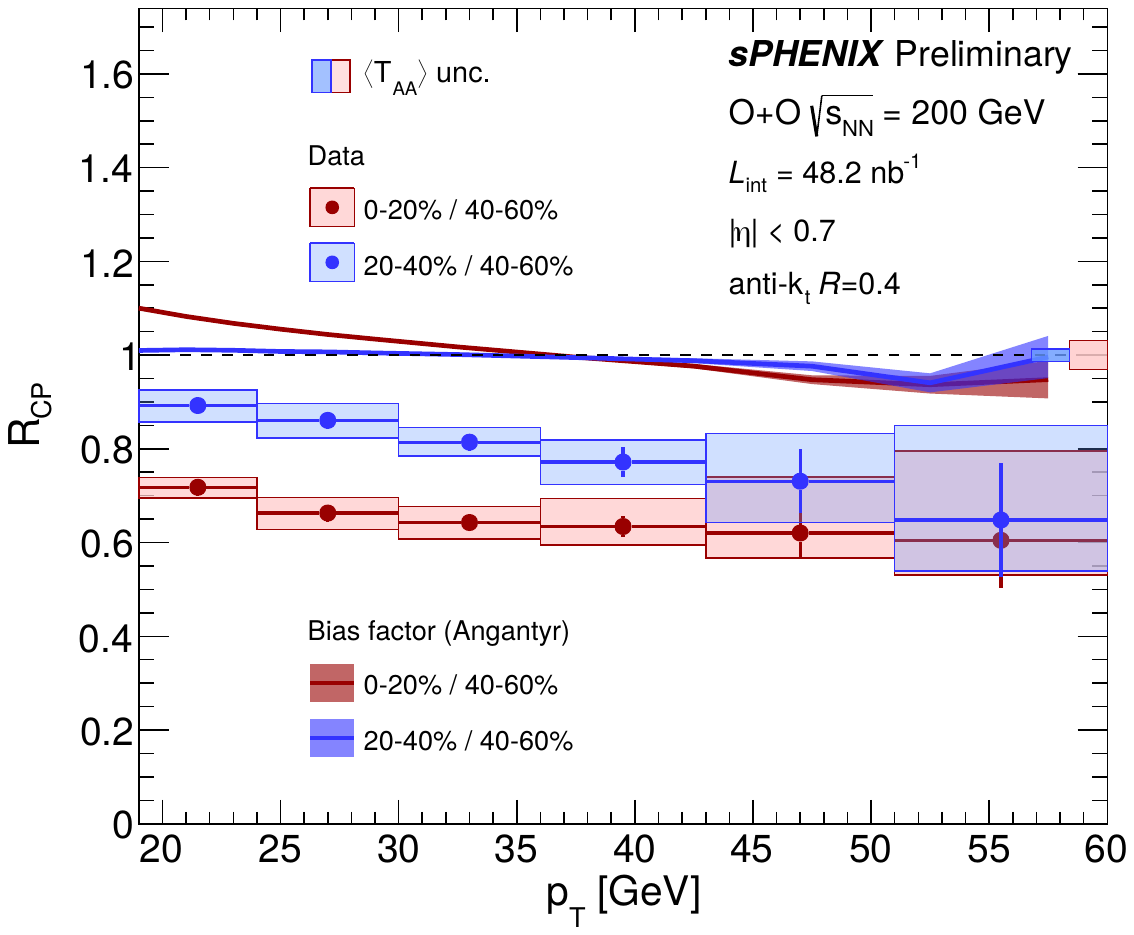
Jet RCP as a function of jet pT for O+O collisions at √sNN = 200 GeV, with the peripheral reference taken as the 60–80% centrality interval (left) and the 40–60% centrality interval (right). The red, blue, and green colors correspond to the selected centrality interval 0–20%, 20–40%, and 40–60%. The vertical lines and boxes represent the statistical and systematic uncertainties, respectively. The boxes at unity show the systematic uncertainties for the Ncoll values. The bands represent the bias factors from ANGANTYR simulation. |
Figure 9 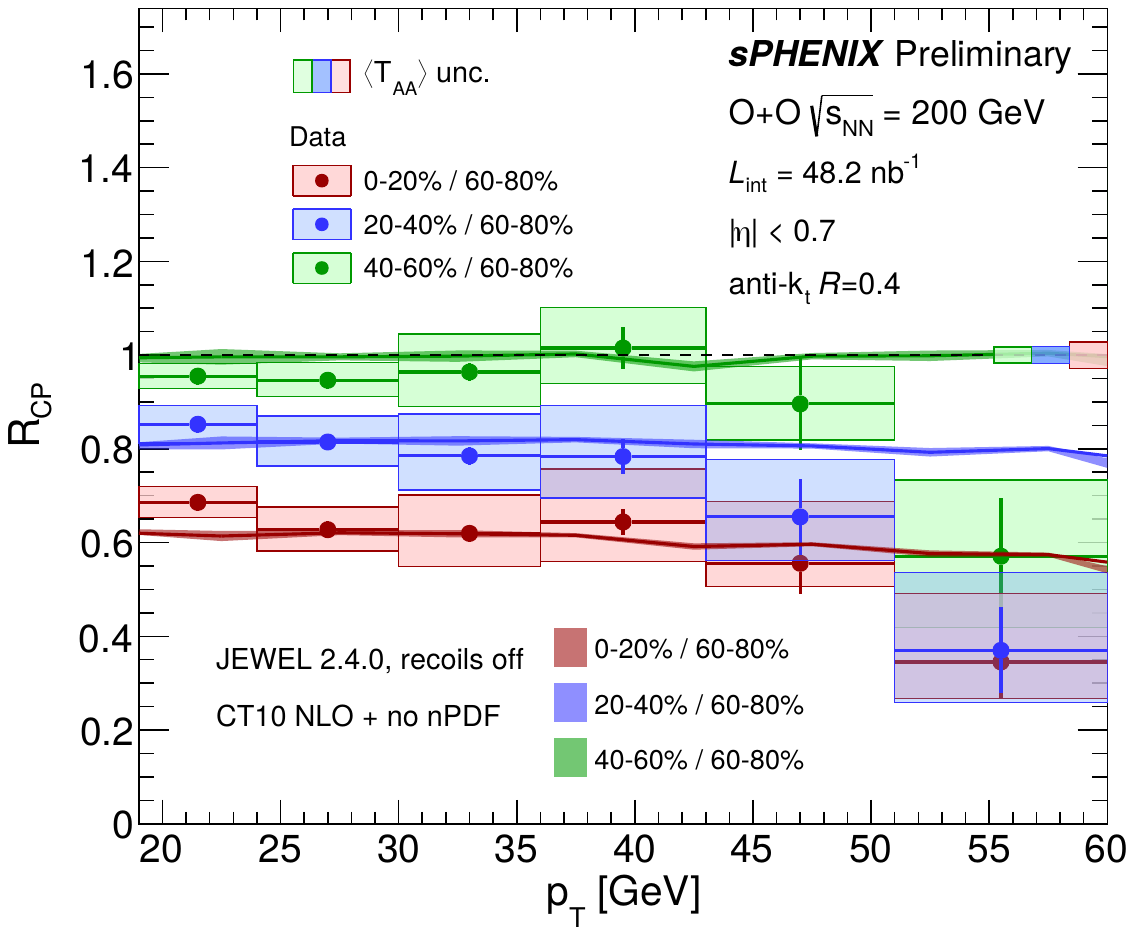
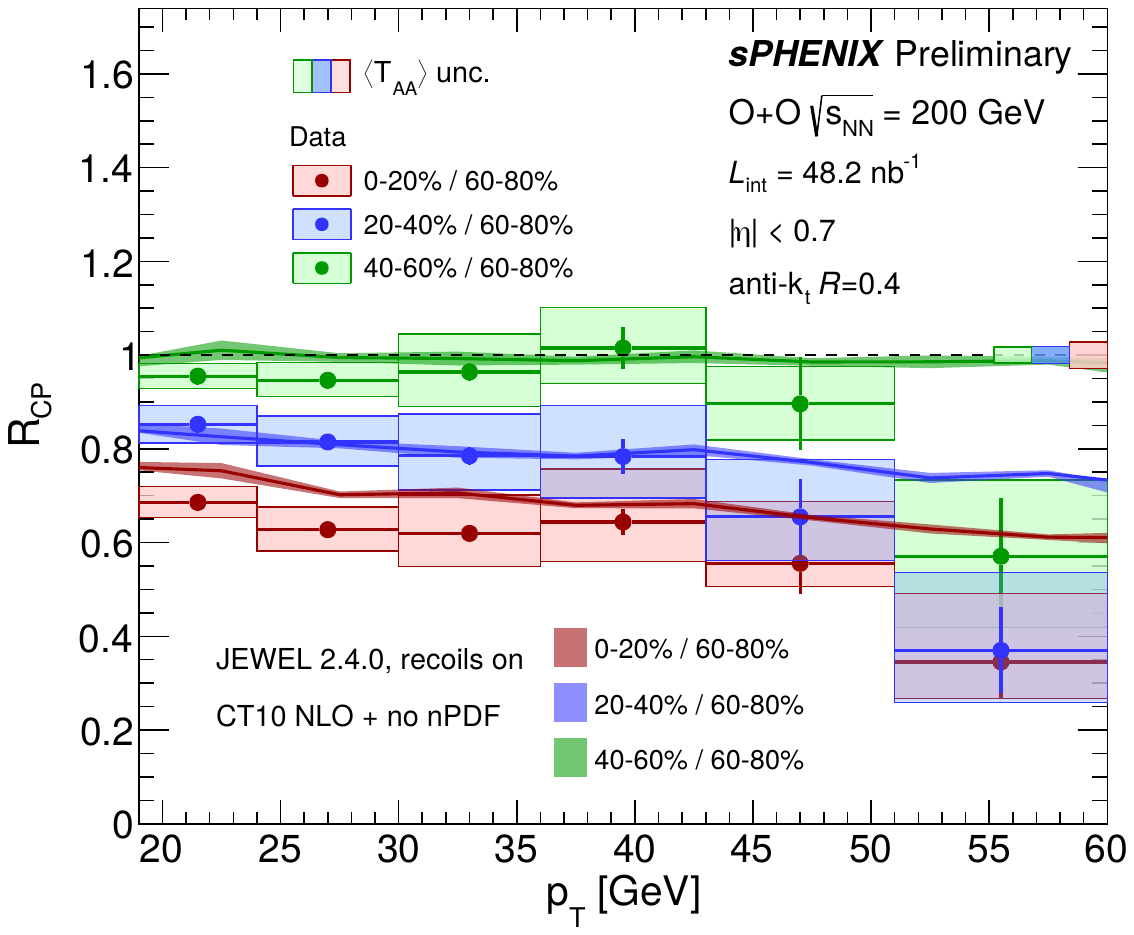
Jet RCP as a function of jet pT for O+O collisions at √sNN = 200 GeV, with the peripheral reference taken as the 60–80% centrality interval. The red, blue, and green colors correspond to the 0–20%, 20–40%, and 40–60% centrality intervals, respectively. The vertical lines and boxes represent the statistical and systematic uncertainties, respectively. The boxes at unity show the systematic uncertainties for the Ncoll values. The bands represent the theoretical predictions from JEWEL without (left) and with (right) recoils enabled. |
Figure 10 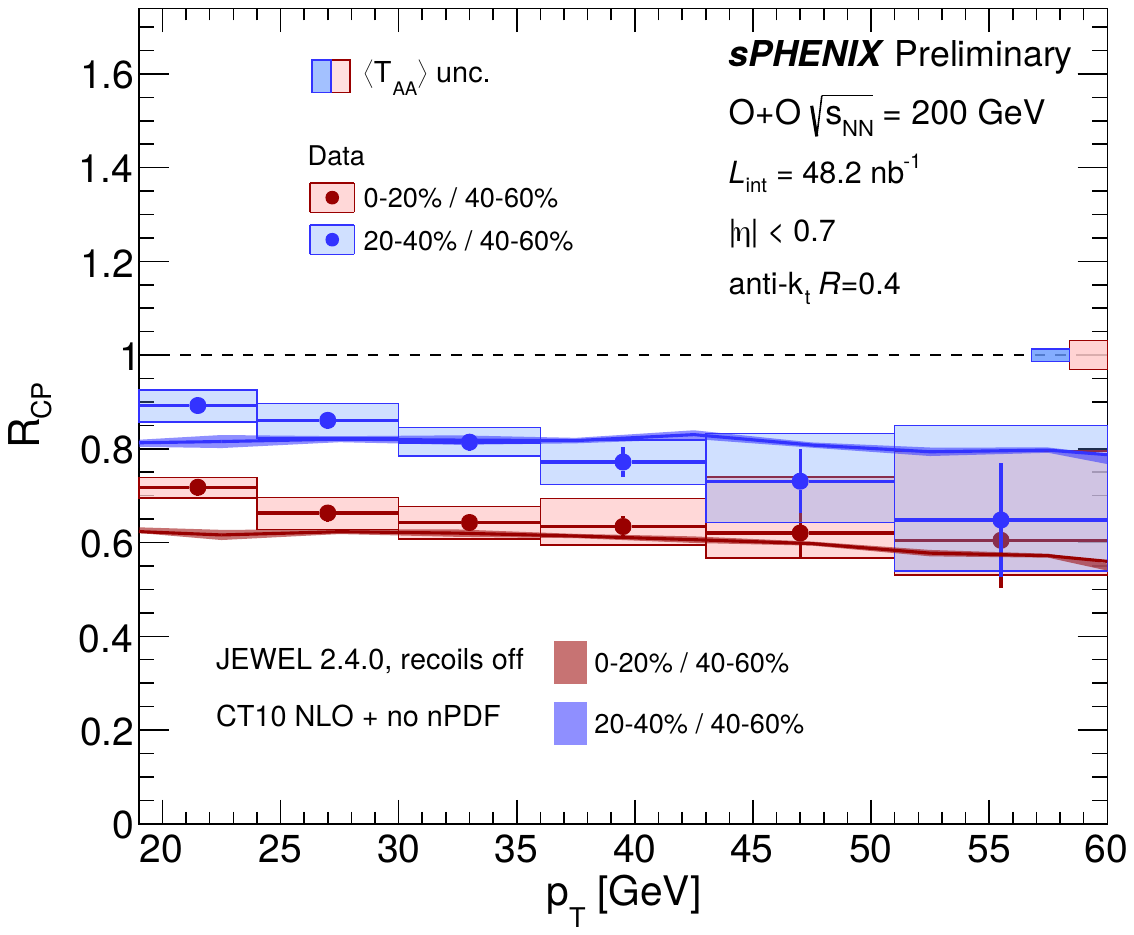
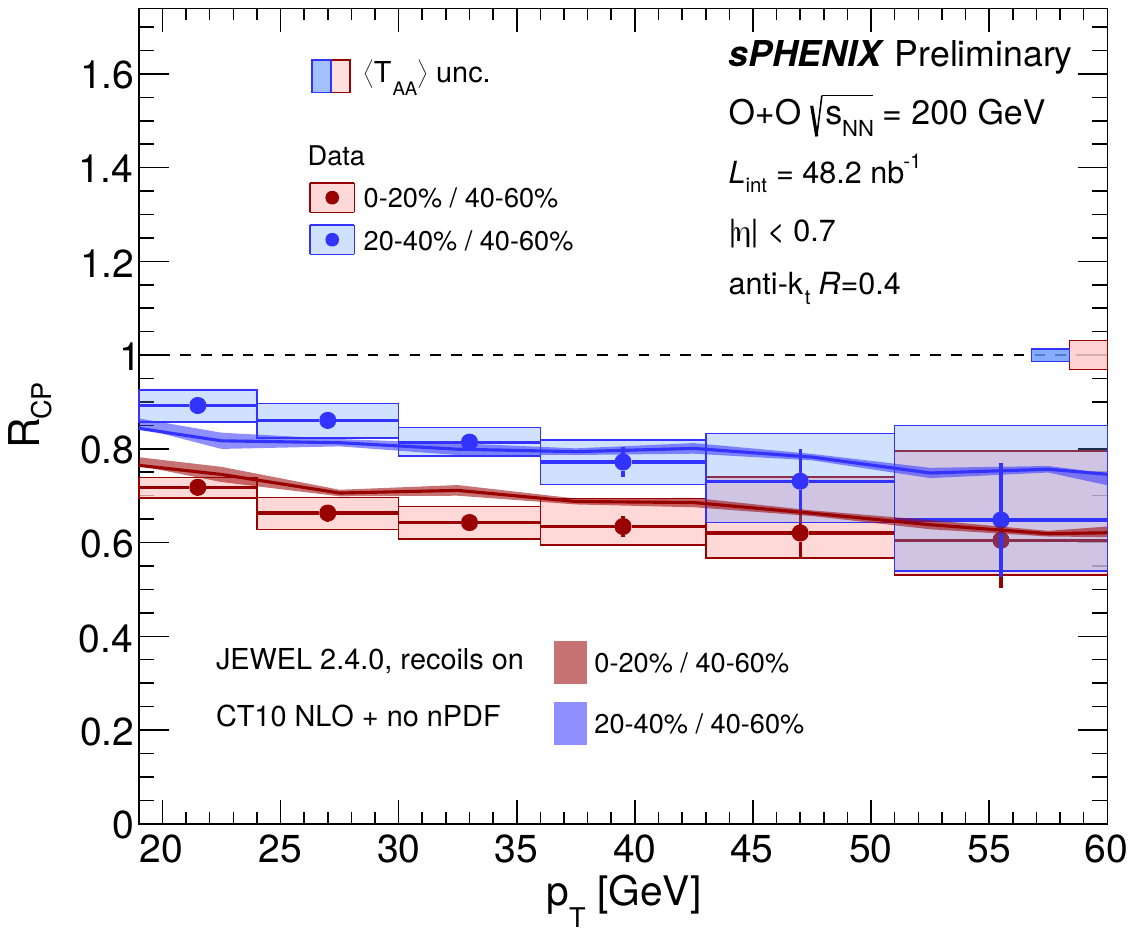
Jet RCP as a function of jet pT for O+O collisions at √sNN = 200 GeV, with the peripheral reference taken as the 40–60% centrality interval. The red and blue colors correspond to the 0–20% and 20–40% centrality intervals, respectively. The vertical lines and boxes represent the statistical and systematic uncertainties, respectively. The boxes at unity show the systematic uncertainties for the Ncoll values. The bands represent the predictions modeled by JEWEL without (left) and with (right) recoils. |
Figure 11 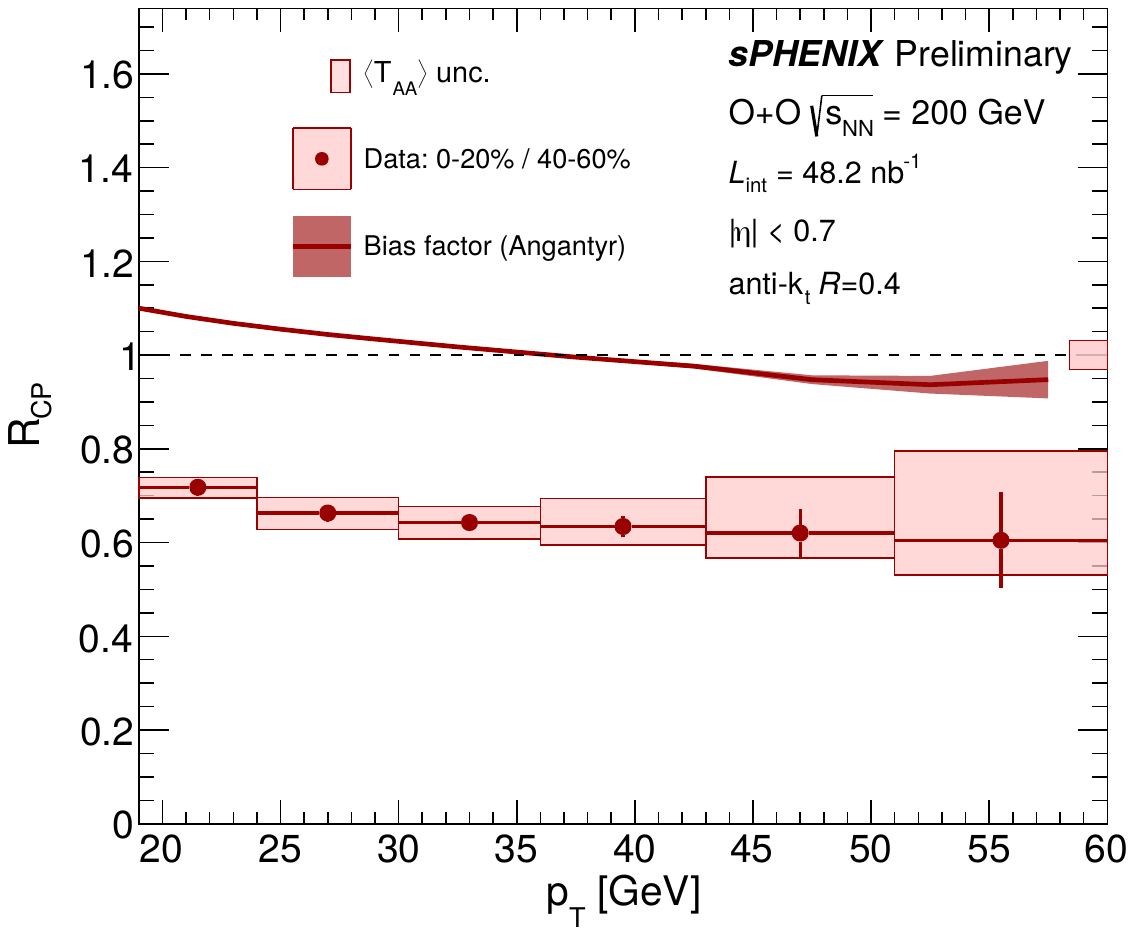
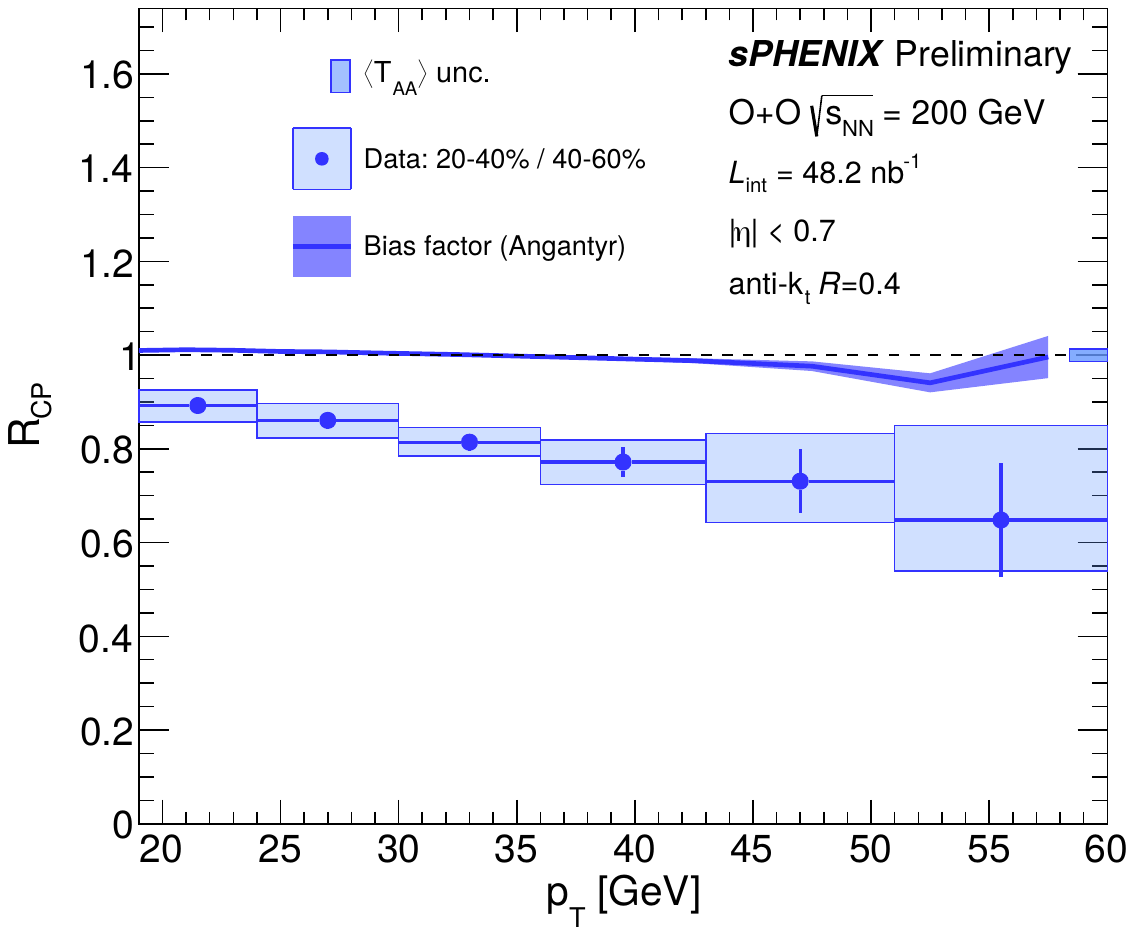
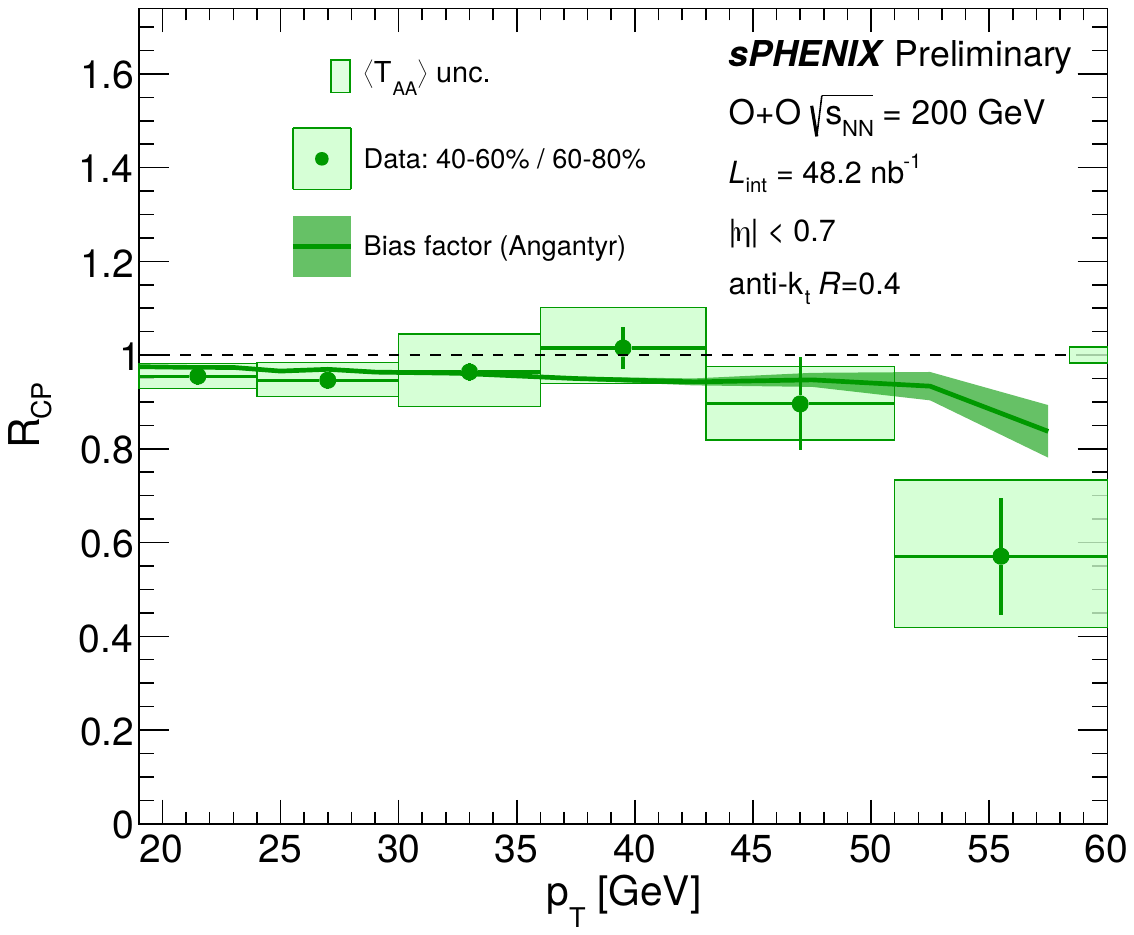
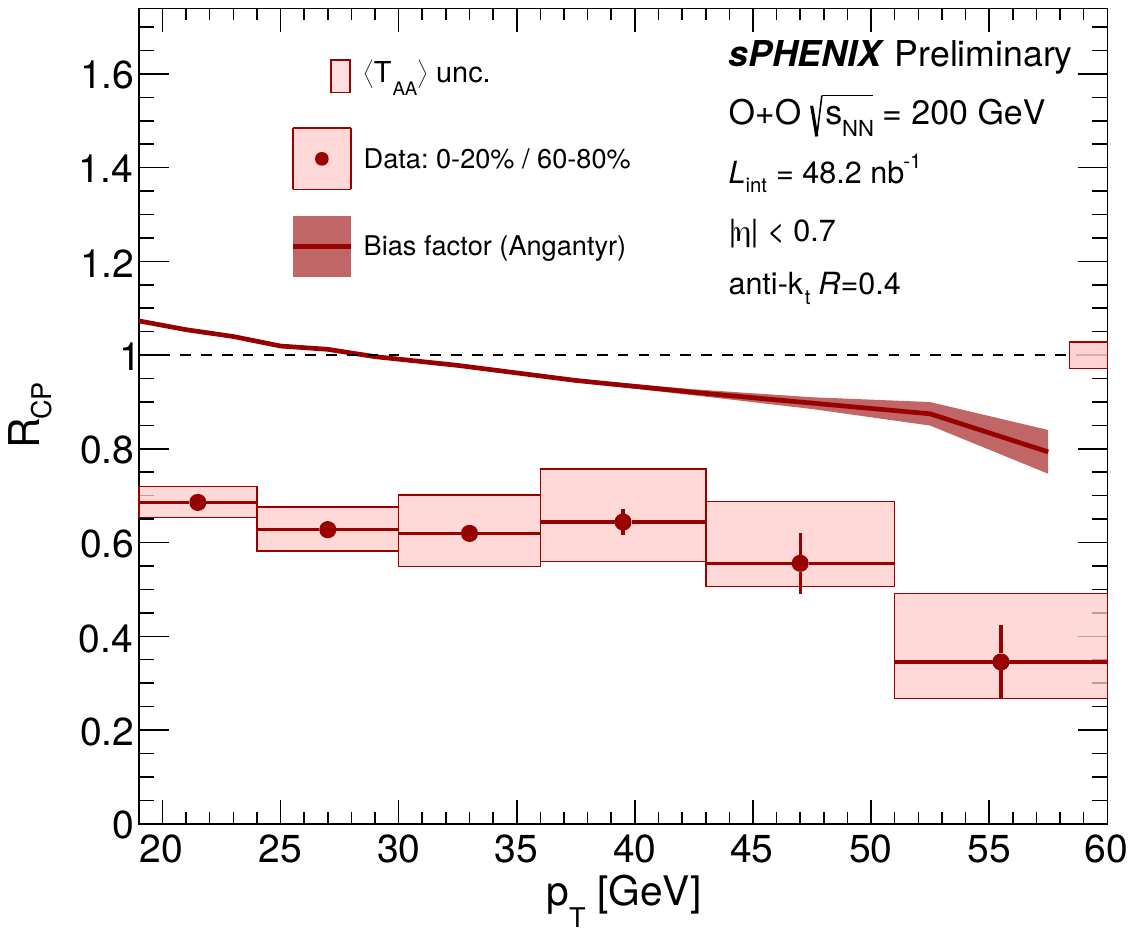
Jet RCP as a function of jet pT for O+O collisions at √sNN = 200 GeV for the reference centrality intervals of 40–60% (top) and 60–80% (bottom). The vertical lines and boxes represent the statistical and systematic uncertainties, respectively. The bands represent the effects of the bias factors obtained from ANGANTYR simulation. |
Figure 12 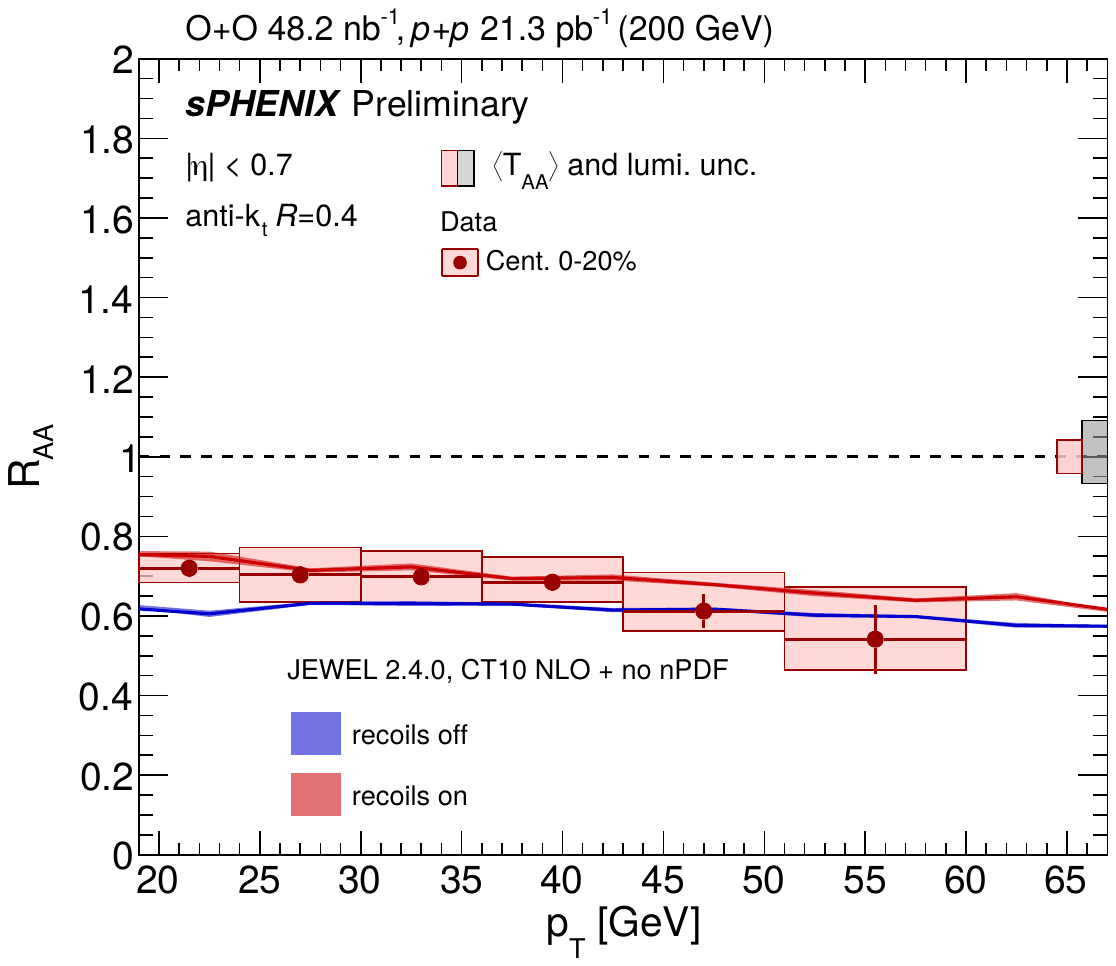
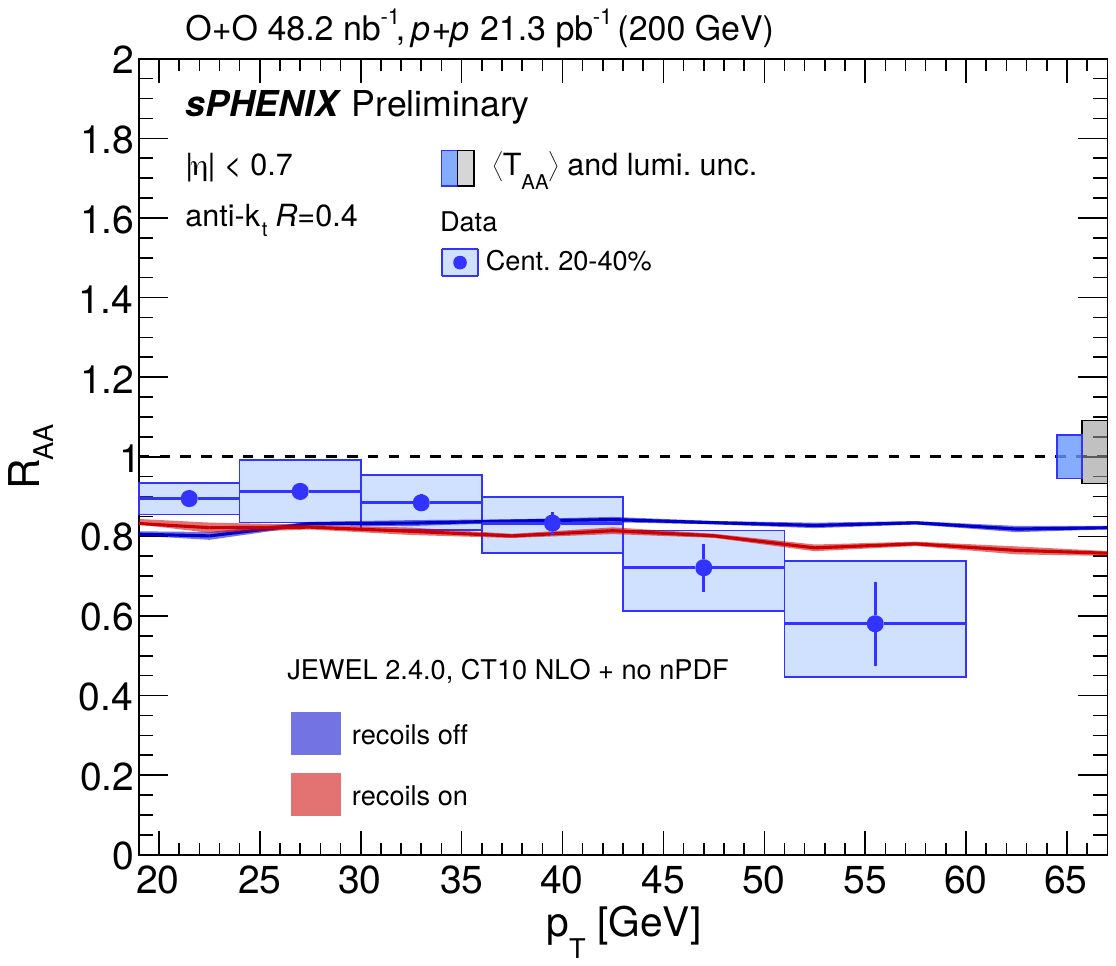
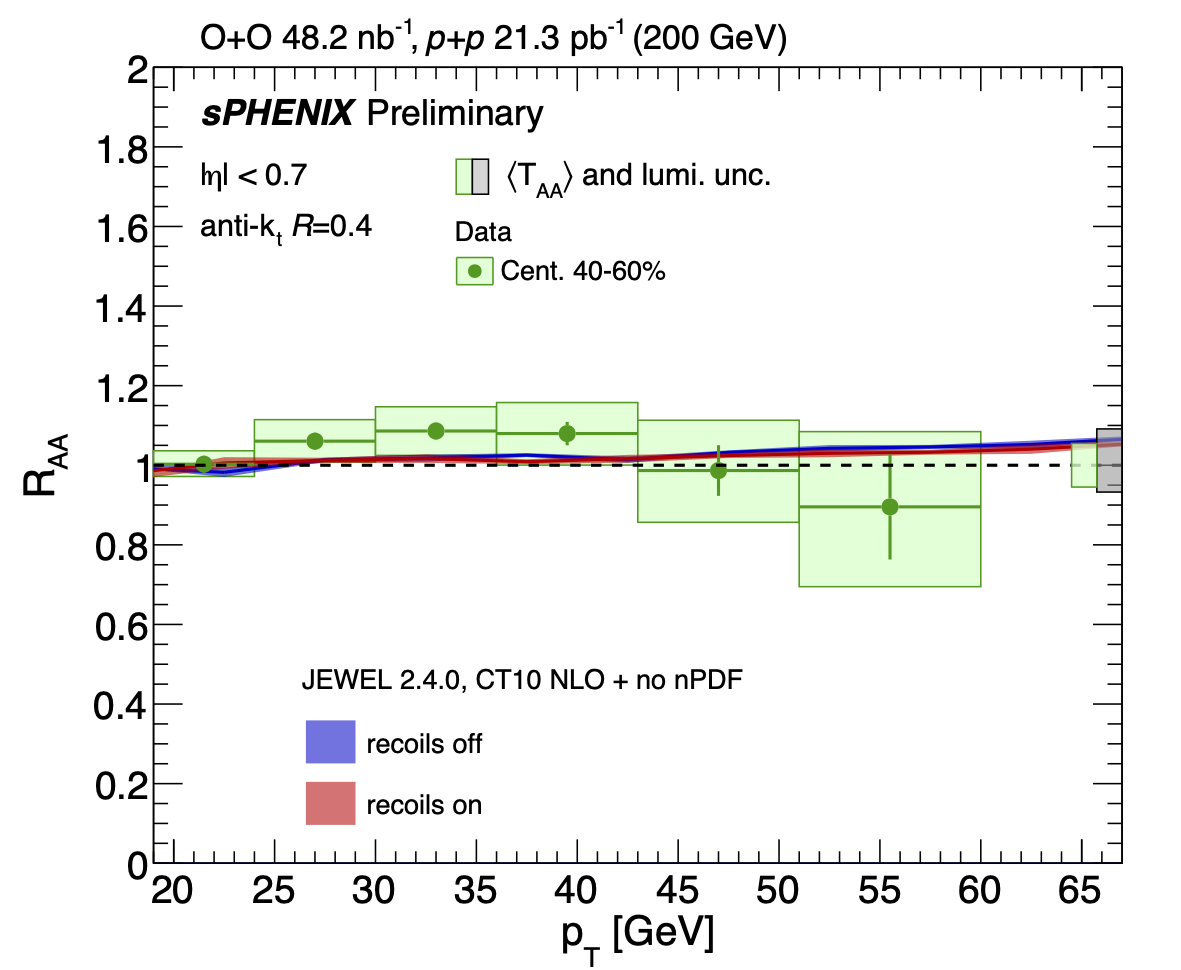
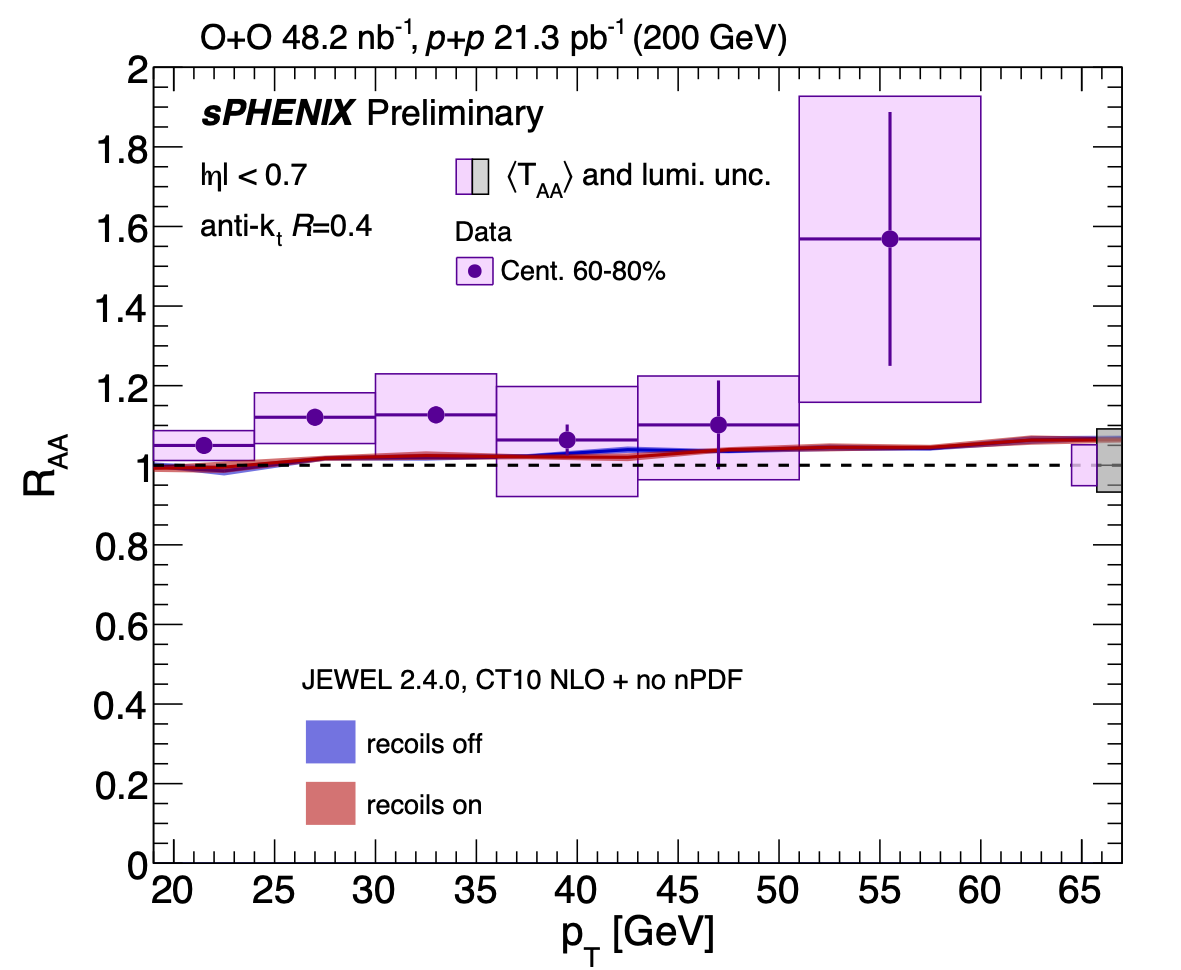
Jet RAA as a function of jet pT for O+O collisions at √sNN = 200 GeV in centrality intervals of 0–20%, 20–40%, 40–60%, and 60–80%. The vertical lines and boxes represent the statistical and systematic uncertainties, respectively. The red and blue bands represent the theoretical predictions from JEWEL with and without recoils enabled. |