
Date: 21 June 2026
Tag: sPH-CONF-JET-2026-03
Document: Conference Note
(Back to sPHENIX Public Results page.)
Figure 1 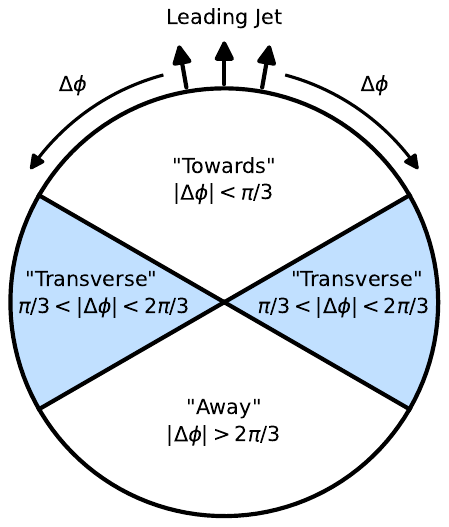
Schematic of "towards", "transverse", and "away" regions of a jet event, where the regions are defined by their |Δφ| with respect to the leading jet φ. |
Figure 2 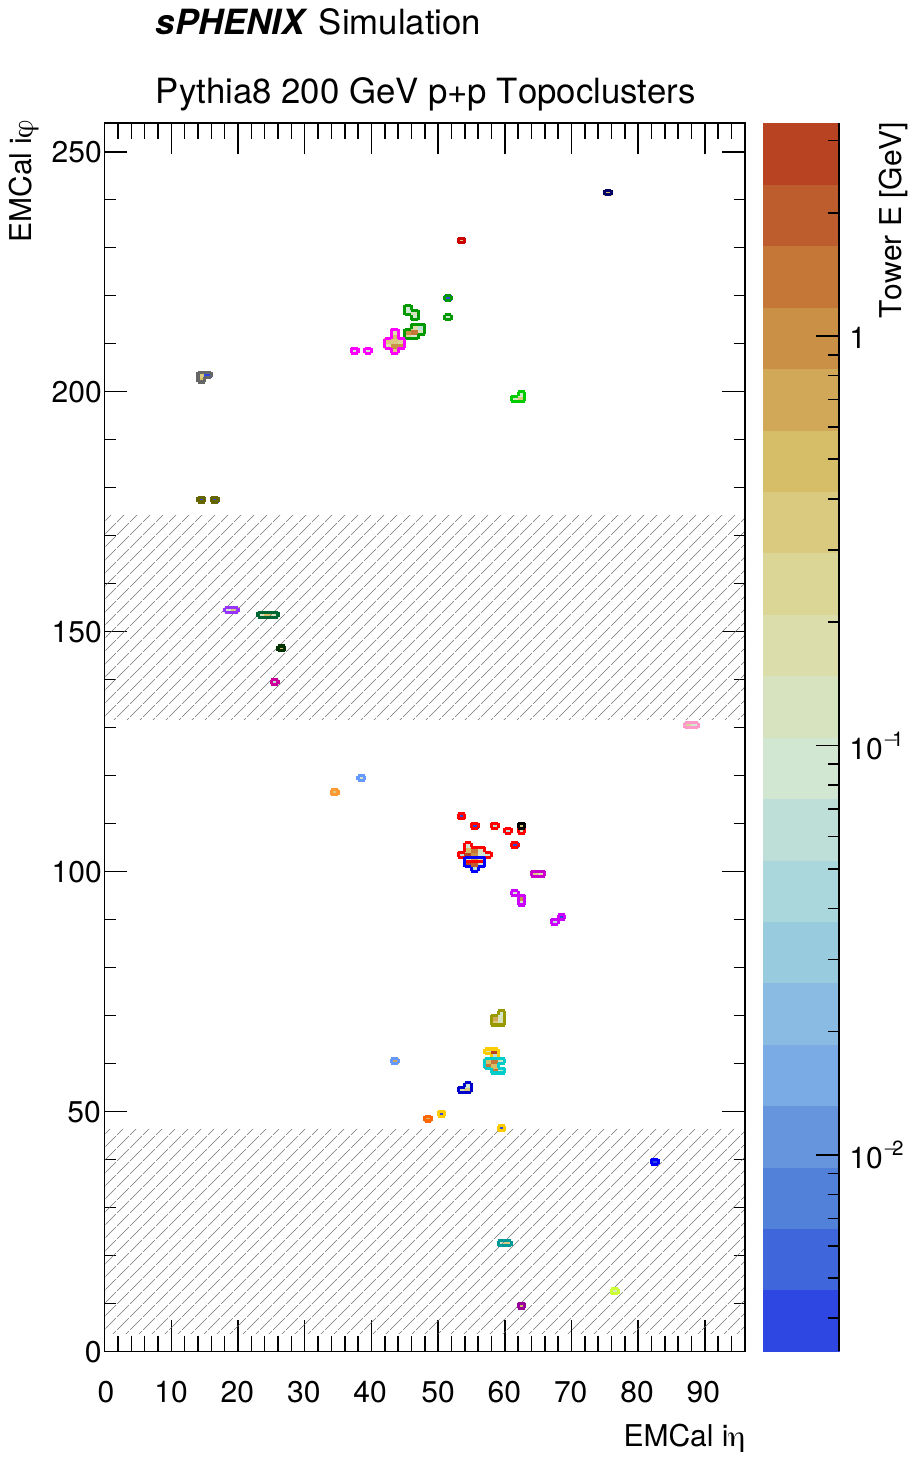
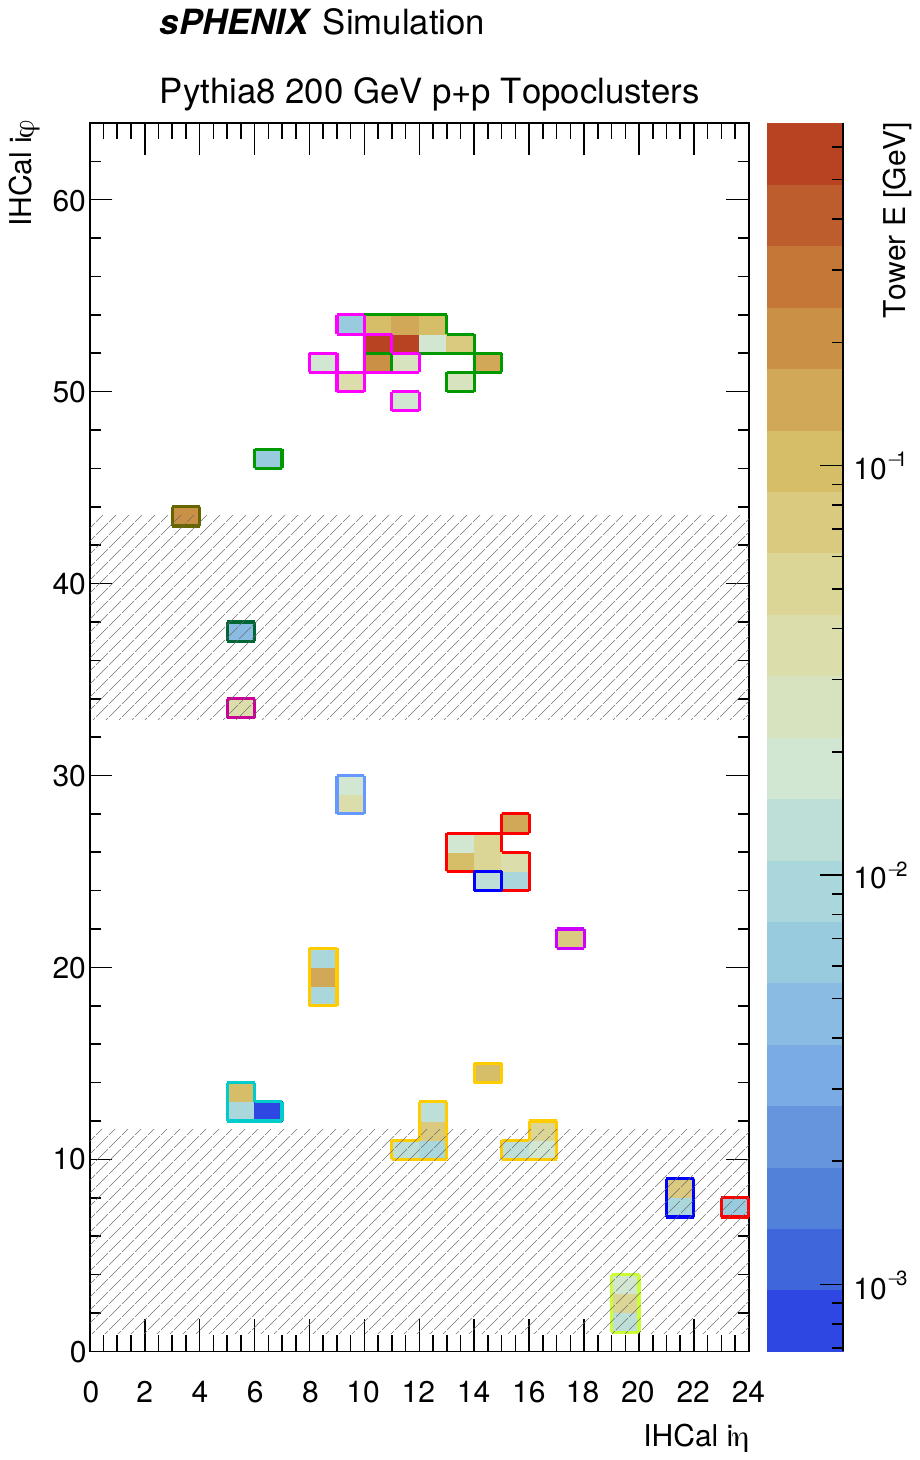
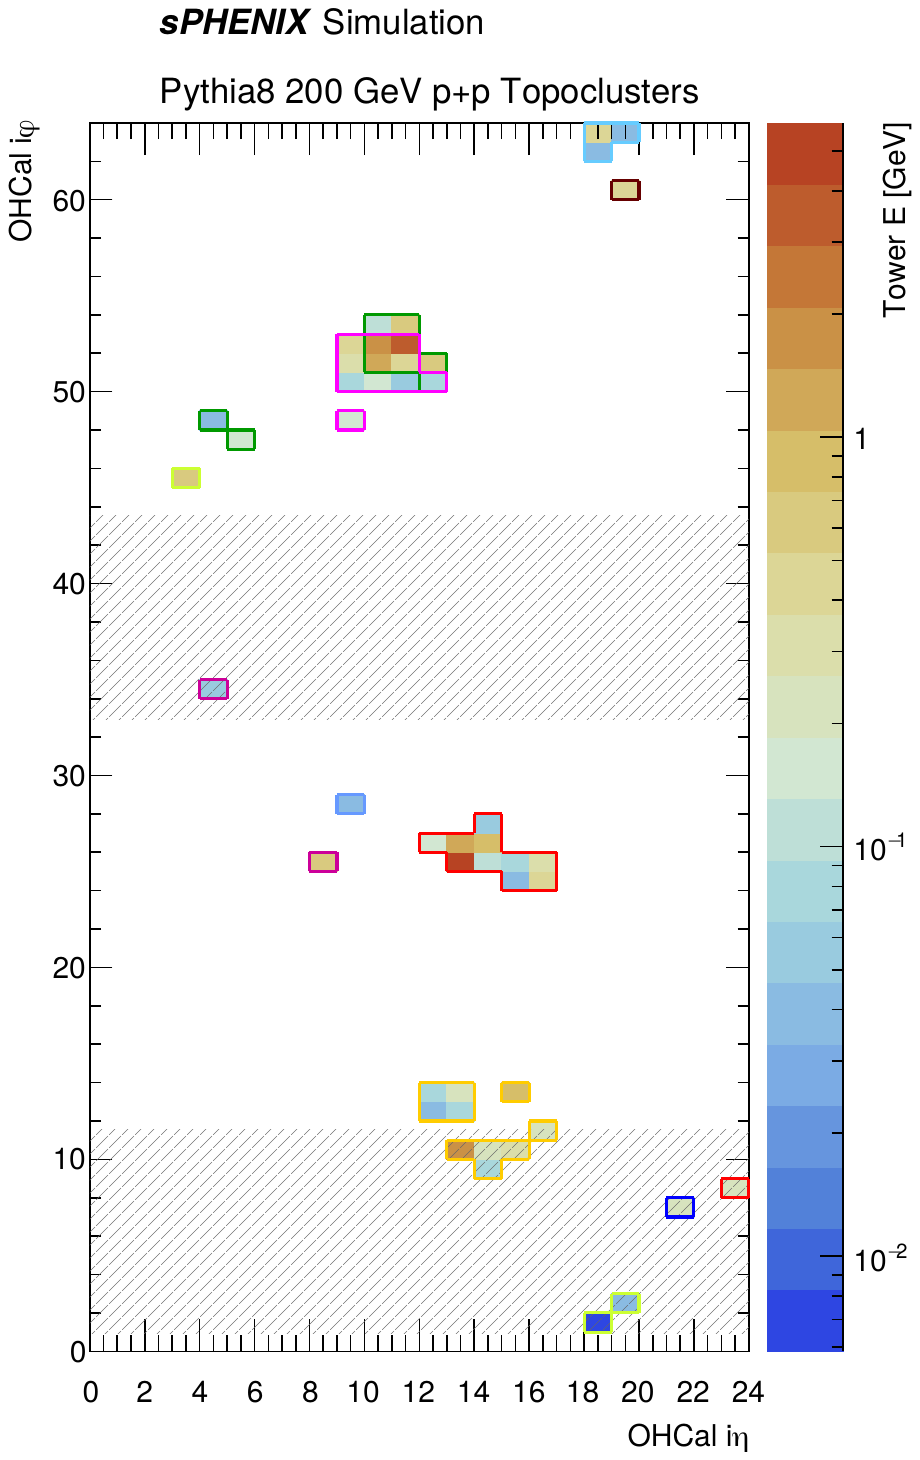
Display of topocluster boundaries (colored line borders) across the EMCal (left), IHCal (middle) and OHCal (right) calorimeter layers for a simulated p+p dijet event in PYTHIA8. Each panel shows a rolled-out projection of the calorimeter acceptance, with the tower pseudorapidity index iη on the horizontal axis and the tower azimuthal index iφ on the vertical axis, where iη and iφ denote the integer tower indices corresponding to tower center positions. Tower energies in GeV are indicated by the fill color, with the scale shown by the color axis on the right. The dijet transverse region for this event is shown in gray shading. |
Figure 3 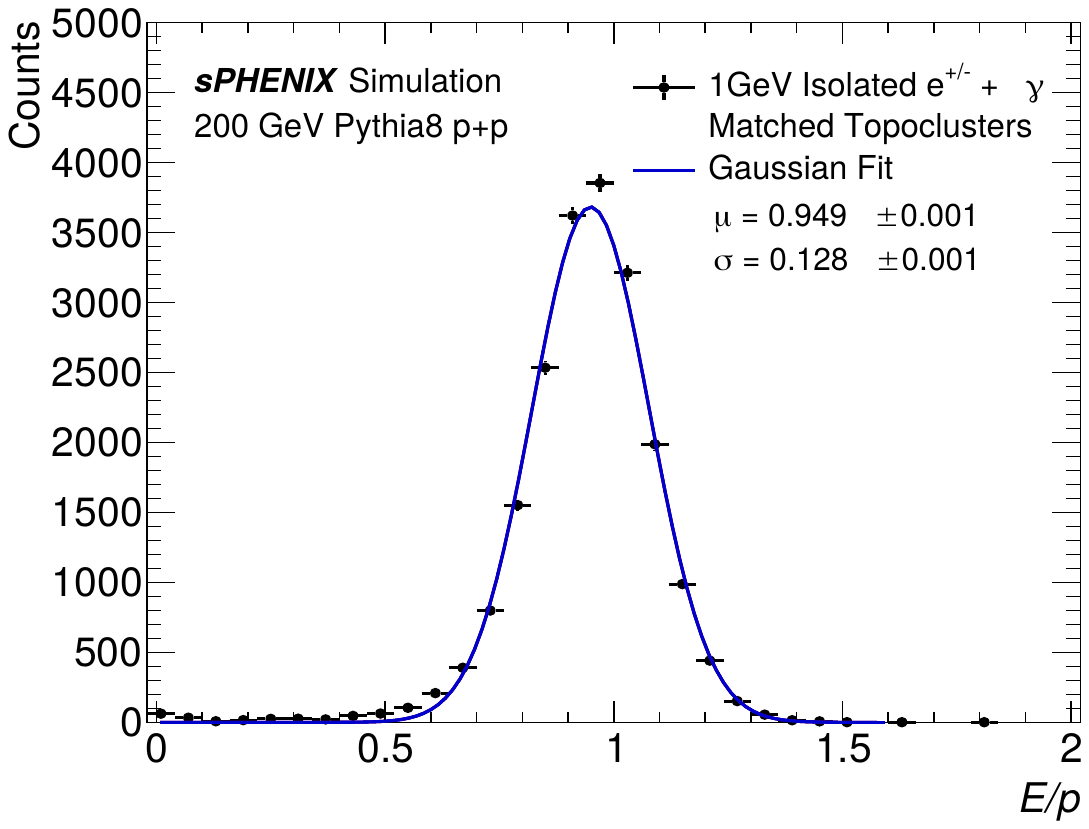
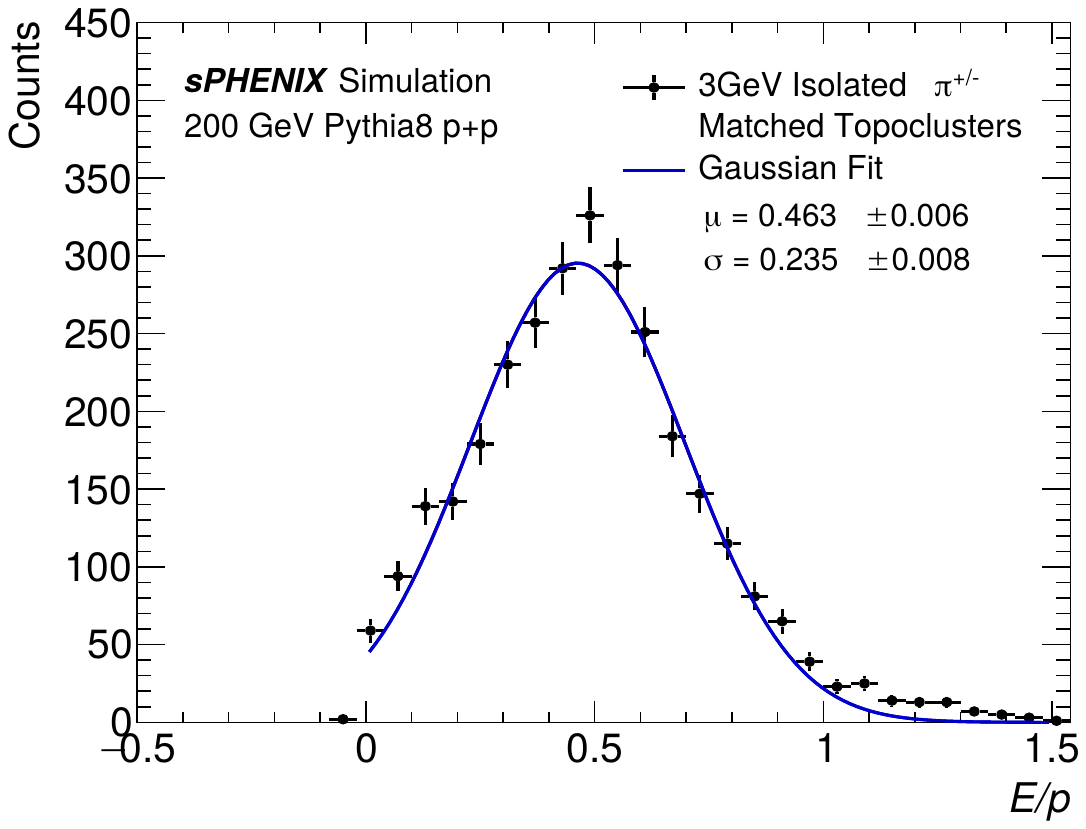
E/p distributions for (left) EM particles (E > 1 GeV, ΔR < 0.1) and (right) hadrons (E > 3 GeV, ΔR < 0.2), using the optimal topocluster noise thresholds for Run 2024 p+p noise conditions. The distributions are shown for isolated single particles in Minimum-Bias p+p PYTHIA8 + GEANT4 simulation events. |
Figure 4 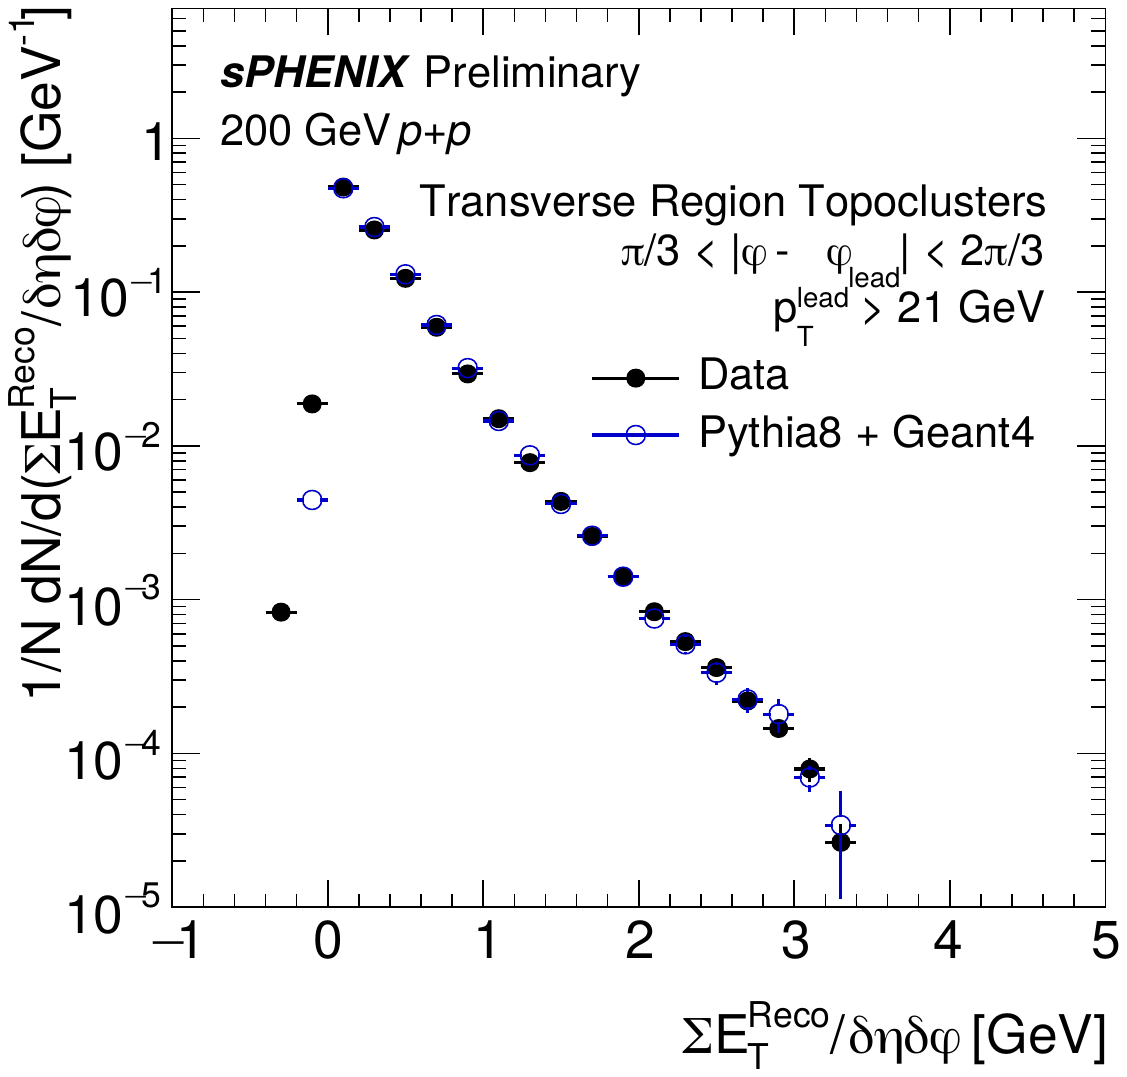
Comparison of reconstruction-level transverse energy density distributions between data (filled black points) and PYTHIA8 + GEANT4 simulation (open blue points) for the transverse region defined with respect to the reconstructed leading jet. The leading jet is defined as the highest-pT jet reconstructed with the anti-kt algorithm (R = 0.4), required to satisfy pTlead > 21 GeV and |ηlead| < 0.7. The transverse energy density distributions are calibrated at the electromagnetic (EM) scale. All event and jet quality selections follow those outlined in the text. |
Figure 5 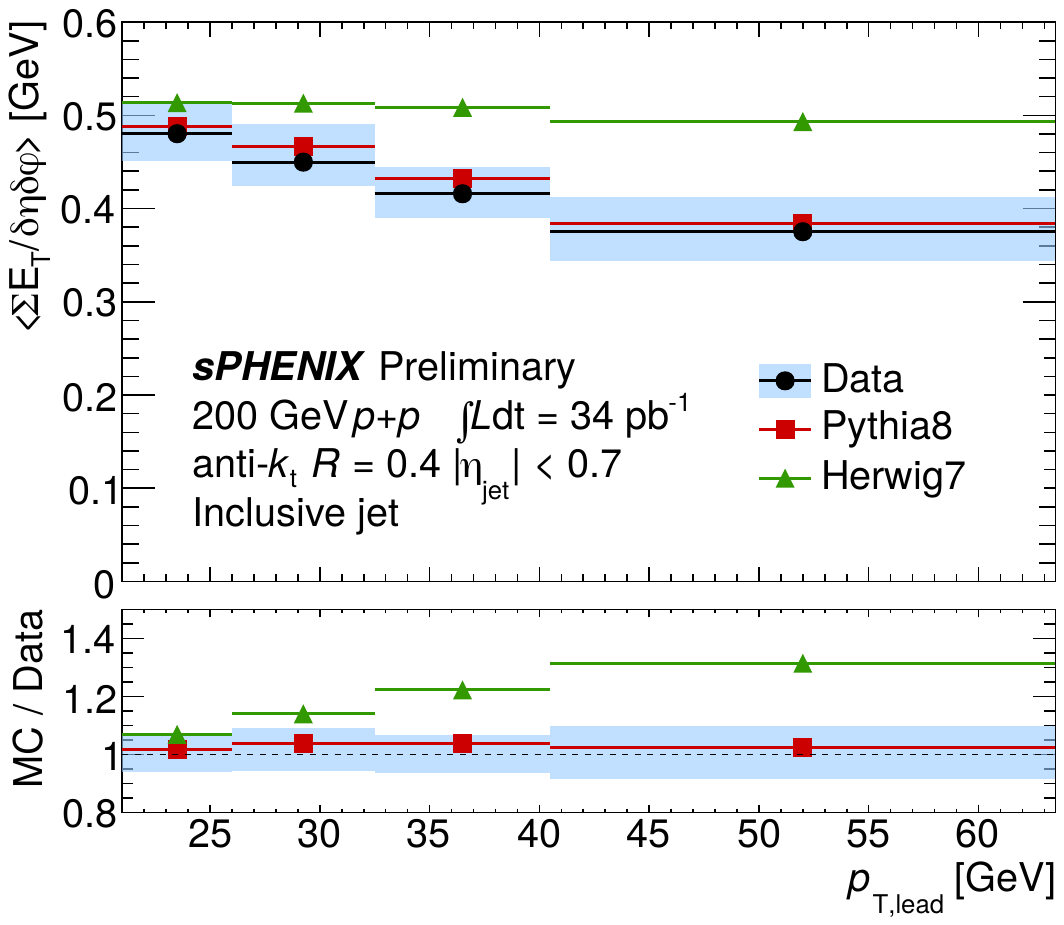
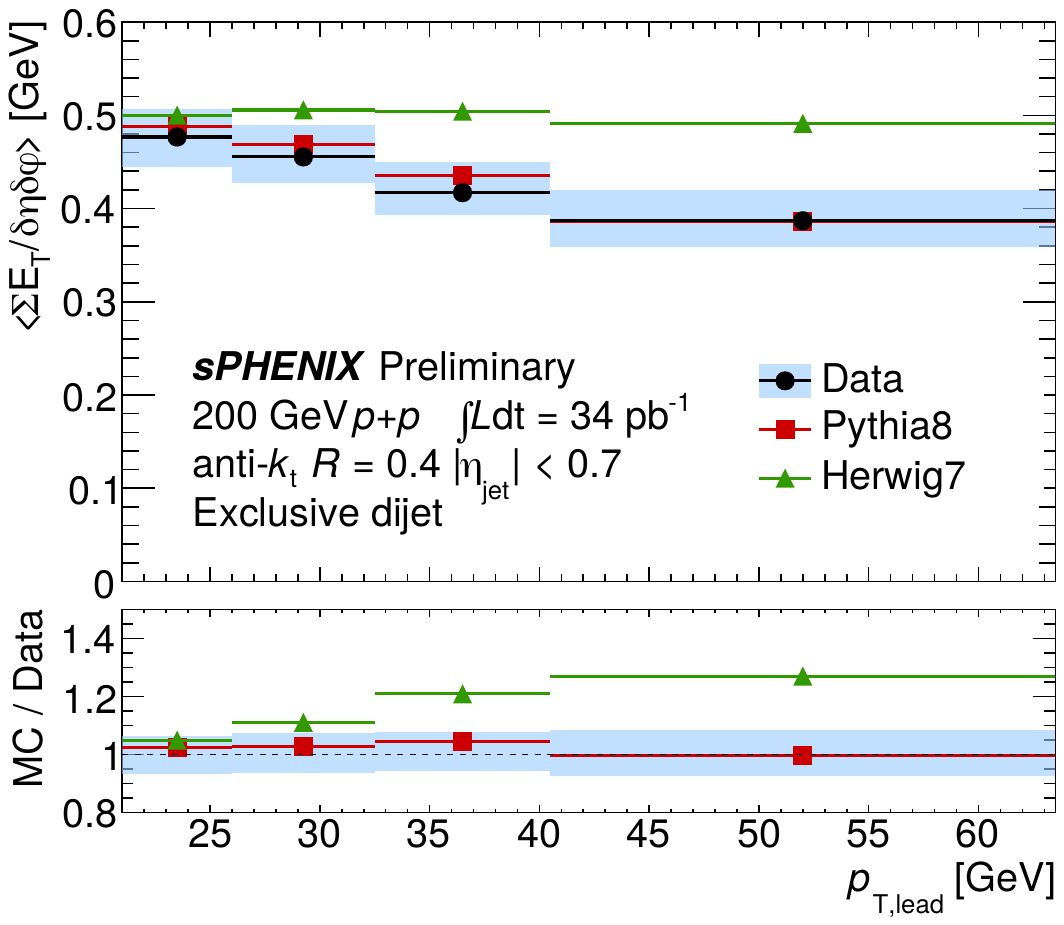
⟨ΣET/δηδφ⟩ in the transverse region across the full calorimeter η acceptance as a function of leading jet pT for inclusive jet (left) and dijet (right) event selections. Data (black points) are shown with statistical uncertainties (bars) and systematic uncertainties (blue bands). The results are compared to generator-level predictions from RHIC-tuned PYTHIA8 Detroit tune (red squares) and HERWIG7 Nashville tune (green triangles). The bottom panels show the ratio of each generator prediction to the data. |
Figure 6 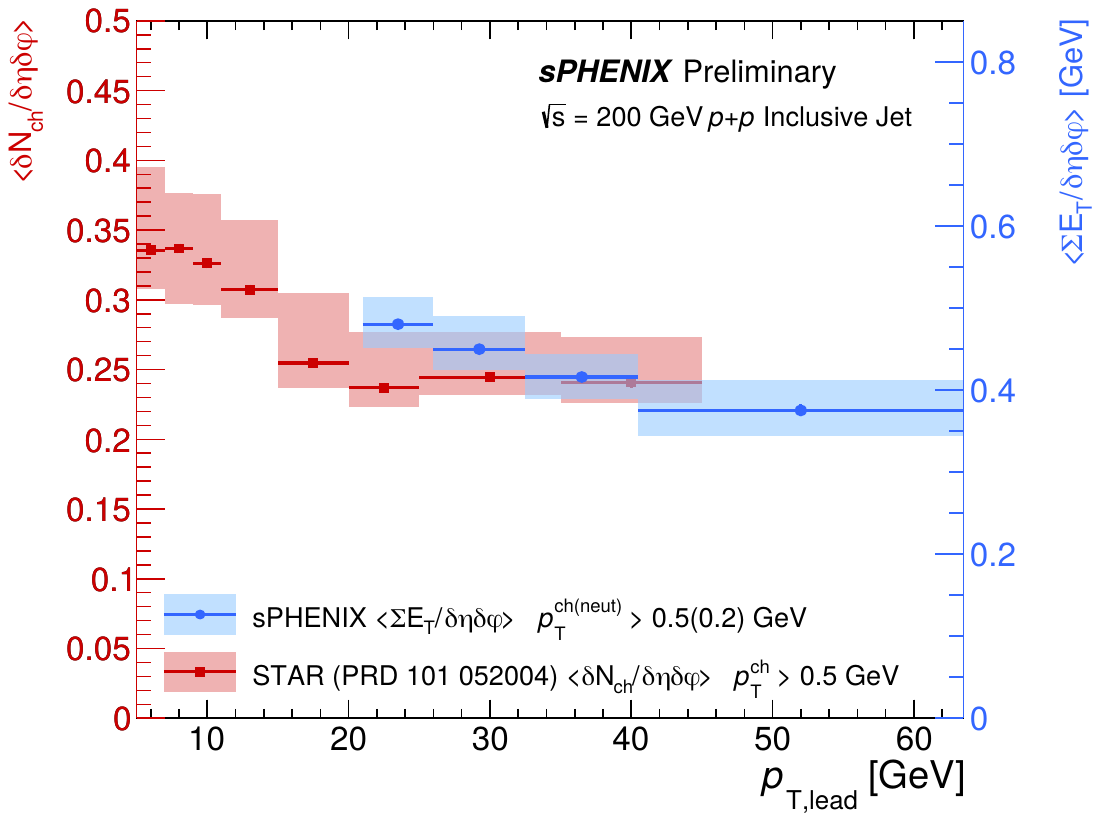
Comparison of the underlying-event activity in the transverse region between sPHENIX and STAR as a function of leading jet pT. The left axis shows the charged-particle density, ⟨dNch/δηδφ⟩, corresponding to the STAR results (red squares), and the right axis shows the transverse energy density, ⟨ΣET/δηδφ⟩, corresponding to the sPHENIX results (light blue circles), over the range 5 < pTlead < 63 GeV. An axis scaling of 1.7 is used to overlay the STAR ⟨δNch/δηδφ⟩ and sPHENIX ⟨ΣET/δηδφ⟩ results. |