Date: 18 March 2025
Tag: sPH-CONF-COLDQCD-2025-01
Document: Conference Note
(Back to sPHENIX Public Results page.)
Figure 1 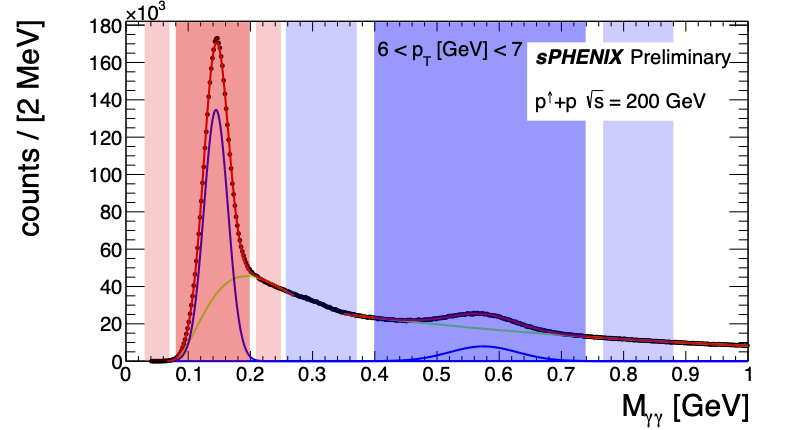 Invariant di-photon mass for an example pT bin. The π0 and η signal (background) regions are indicated by the dark (light) shaded areas. The data are fit with a Gaussian to determine the peak location (mean) and width (σ), superimposed on a threshold function with exponential to
describe the background. The background fraction r is determined from fit integrals.
Invariant di-photon mass for an example pT bin. The π0 and η signal (background) regions are indicated by the dark (light) shaded areas. The data are fit with a Gaussian to determine the peak location (mean) and width (σ), superimposed on a threshold function with exponential to
describe the background. The background fraction r is determined from fit integrals.
|
Figure 2 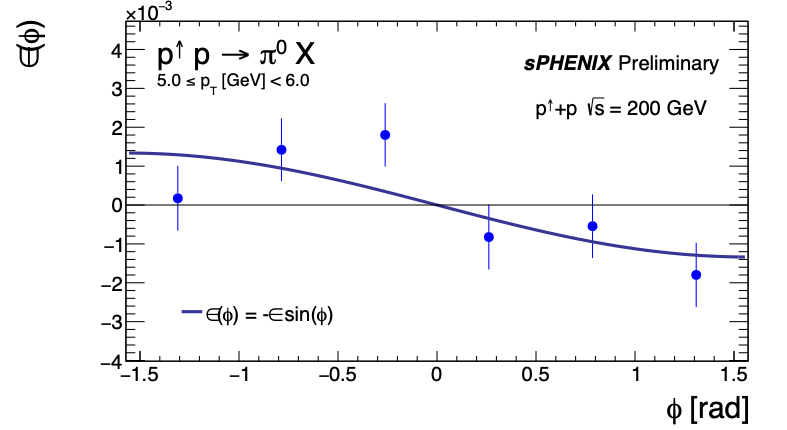
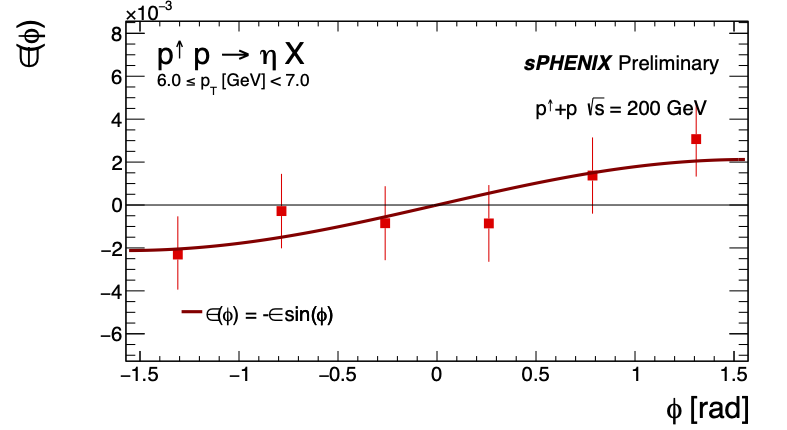
Raw asymmetry ε(φ) extracted in example pT bins for di-photons in the the π0- (top) and η-meson (bottom) mass windows, when the anti-clockwise beam is taken as transversely polarized. |
Figure 3 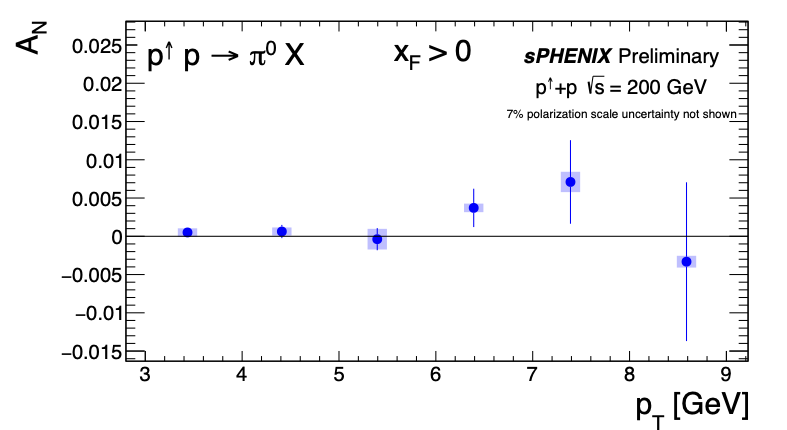
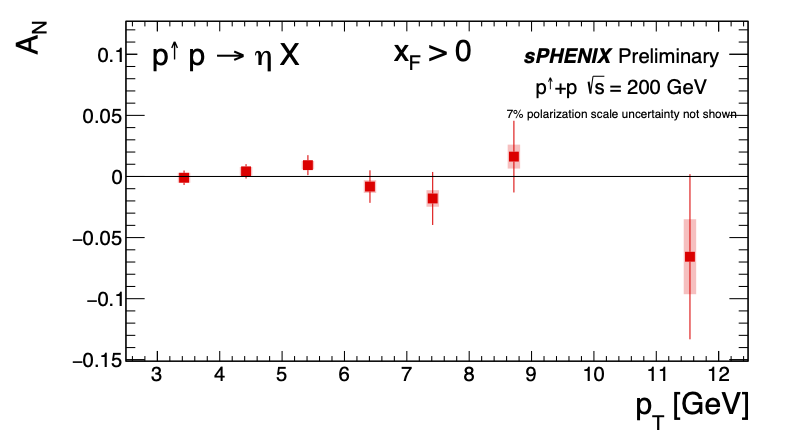
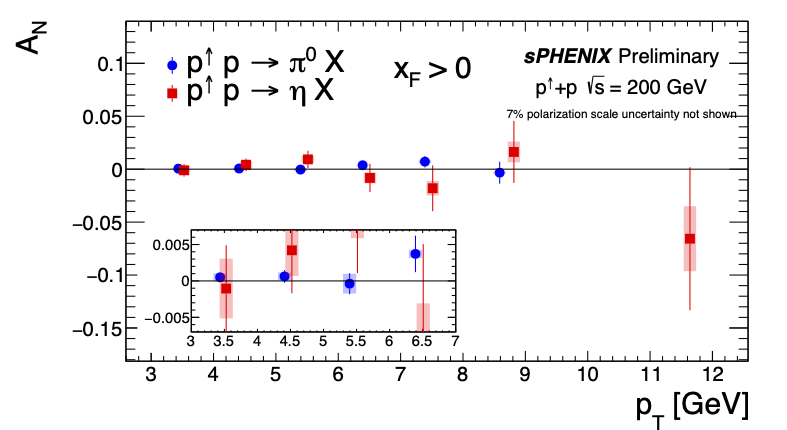
Preliminary sPHENIX results of the transverse single-spin asymmetry versus di-photon transverse momentum pT in inclusive production of π0-mesons (top) and η-mesons (middle), and a comparison between π0- and η-meson results (bottom), in collisions of transversely polarized protons at √s = 200 GeV. The error bars indicate the statistical uncertainties, the shaded boxes the systematic uncertainties. The η-meson points are slightly offset horizontally for better visibility. |
Figure 4 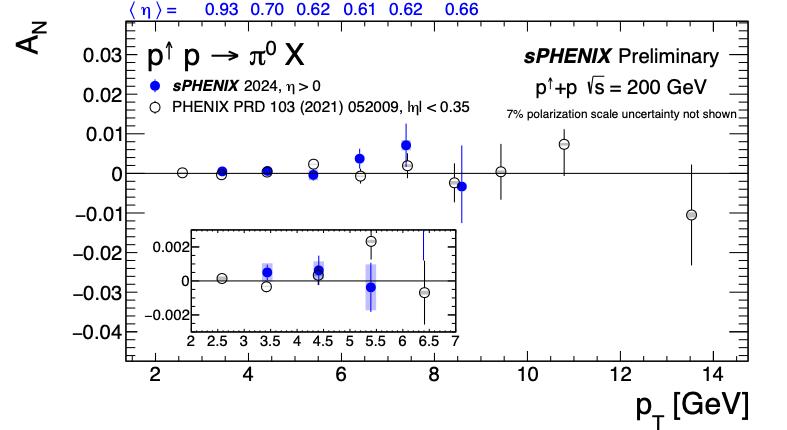
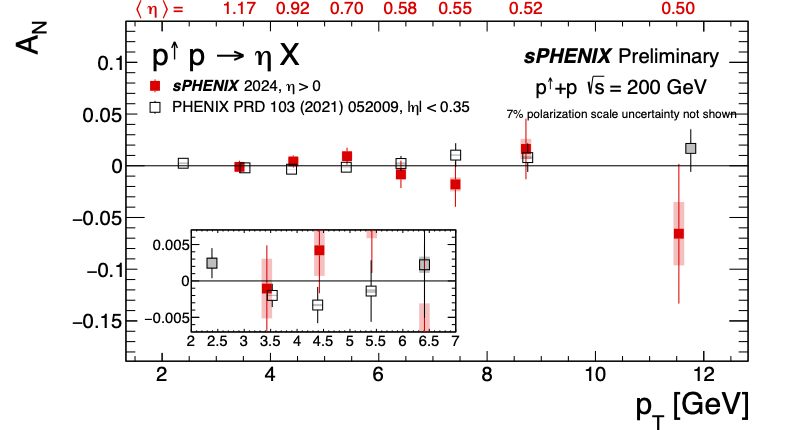
Preliminary sPHENIX Run-2024 results compared to PHENIX Run-2015 results in inclusive production of π0-mesons (top) and η-mesons (bottom) in collisions of transversely polarized protons at √s = 200 GeV. The error bars indicate the statistical uncertainties, the shaded boxes the systematic uncertainties. The average sPHENIX pseudorapidity values <η> are indicated for each pT bin. |