Date: 2 April 2025
Tag: sPH-BULK-2025-02
Document: arXiv preprint, PRC 112 (2025) 024908
(Back to sPHENIX Public Results page.)
Figure 1 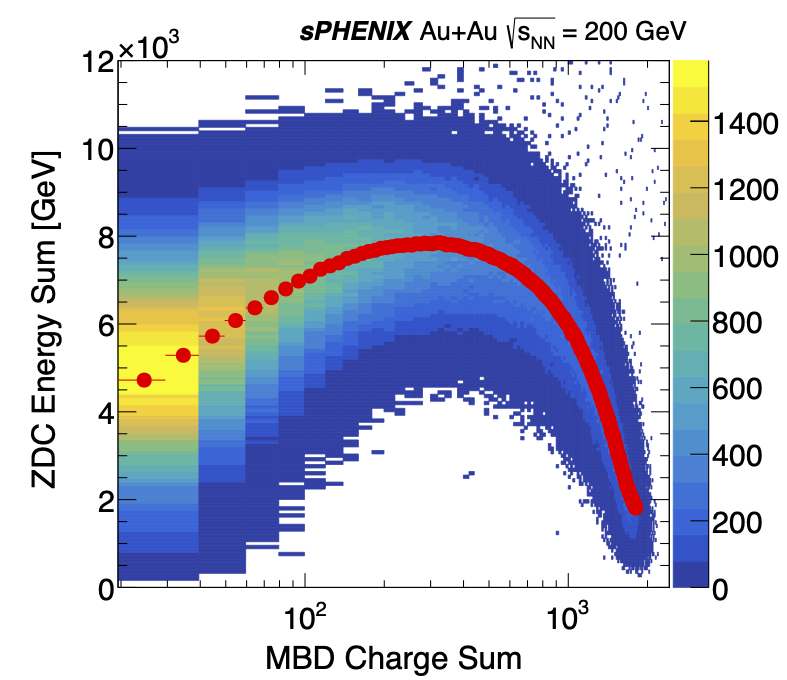
The correlation between the total energy in ZDCs and the MBD charge sum is shown. The MBD charge sum is in units of calibrated MIPs. The red points indicate the average ZDC energy as a function of MBD charge sum. |
Figure 2 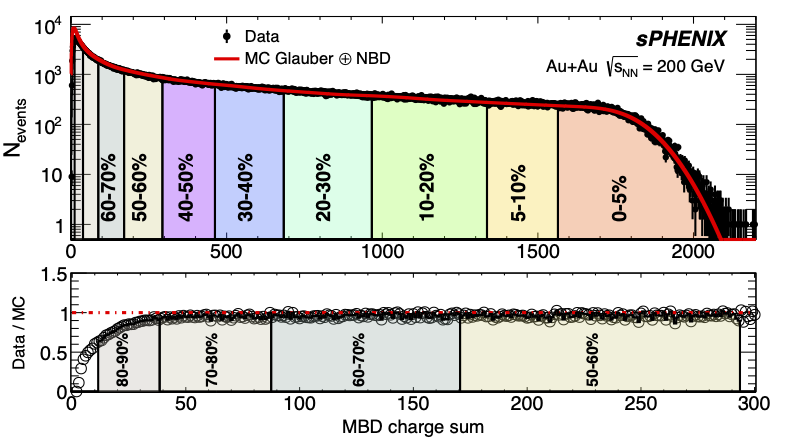
The MBD charge sum distribution in minimum-bias Au+Au events (points), compared to the best fit from a MC Glauber ⊕ NBD simulation (red line). The shaded bands indicate 5%-wide centrality intervals. The lower panel highlights the ratio of the MBD charge sum to the MC Glauber ⊕ NBD fit in the peripheral event region, showing the effect of the trigger turn on. The MBD charge sum is in units of calibrated MIPs. |
Table 1 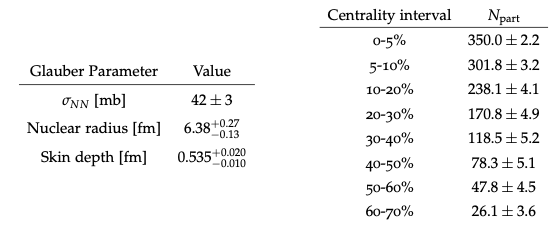
Glauber model parameters (left) for Au+Au collisions at √sNN = 200 GeV. Centrality intervals and average number of participating nucleons (Npart) for Au+Au collisions at √sNN = 200 GeV (right) obtained using Glauber model. |
Figure 3 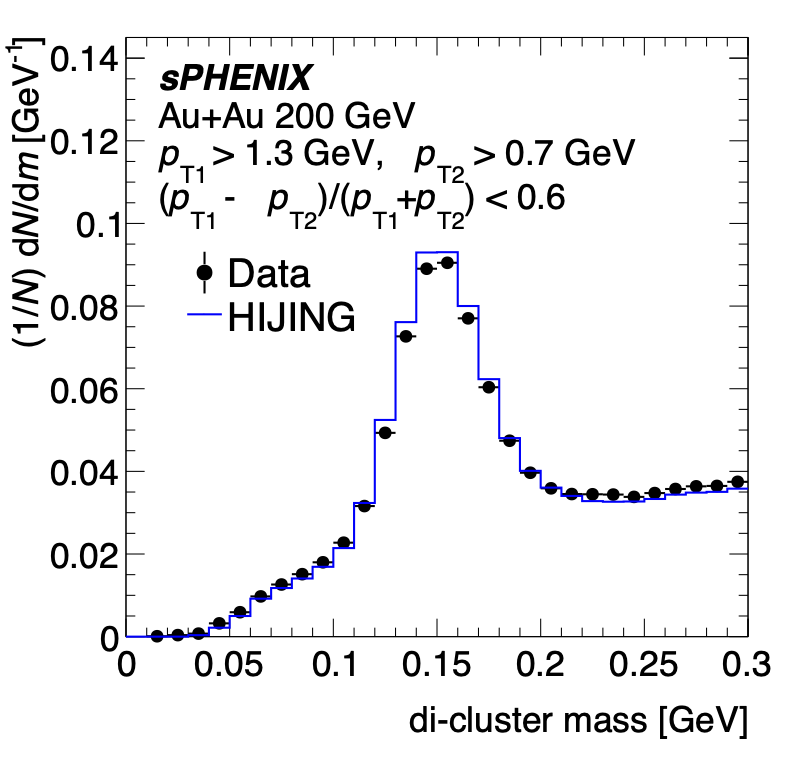
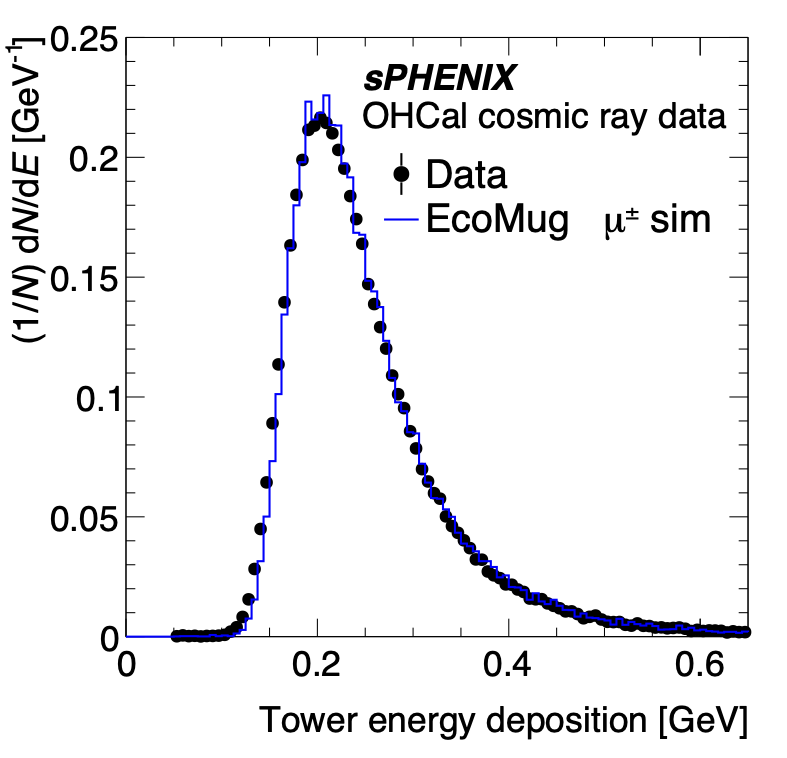
Panel (a) provides an example of a reconstructed EMCal di-cluster invariant mass distribution, similar to those used for in situ EMCal tower calibrations. The distributions are made from EMCal cluster pairs using Run 2024 Au+Au data (points) and a GEANT-4 simulation of HIJING events (histogram). The prominent peak arises from π0→γγ decays. Panel (b) illustrates an example of the measured energy distribution in a single OHCal tower, comparing the MIP distribution from cosmic-ray data from the detector (points) and from a GEANT-4 simulation of cosmic-ray muons from EcoMug (histogram). |
Table 2 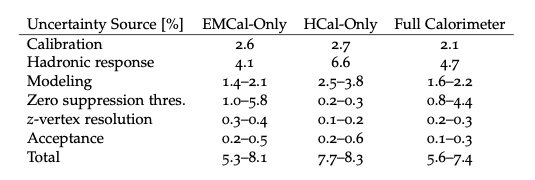
Overview of major systematic uncertainties contributing to the measurement. The range of magnitudes of uncertainties, in percent, are shown for each source (rows) for the measurements using different calorimeter systems (columns), with the total uncertainty shown in the final row. The ranges correspond to the η-averaged variation of the magnitude for different event centralities. Uncertainties on Npart depend only on centrality, range from 0.6-9.5%, and are listed in Table 1. |
Figure 4 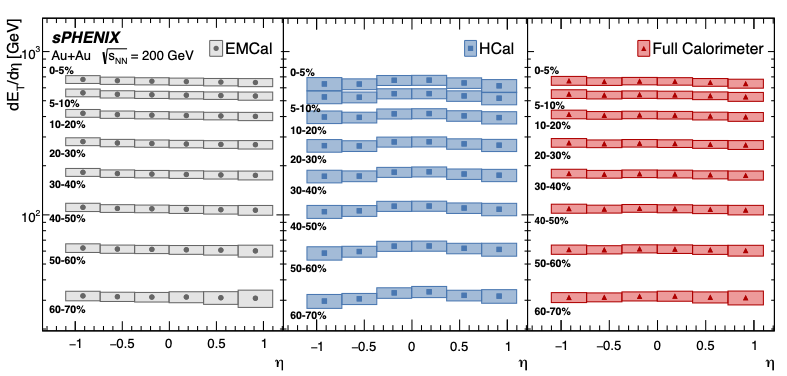
Summary of dET/dη measurements in Au+Au collisions at √sNN = 200 GeV over the pseudorapidity range |η| < 1.1. Different data series correspond to centrality selections within the range 0-60% (labeled). The different panels show the results determined using the EMCal-only (left), HCal-only (center), and the full calorimeter system (right). The vertical size of the boxes around each point indicate the total systematic uncertainty, while the horizontal size indicates the η bin width. |
Figure 5 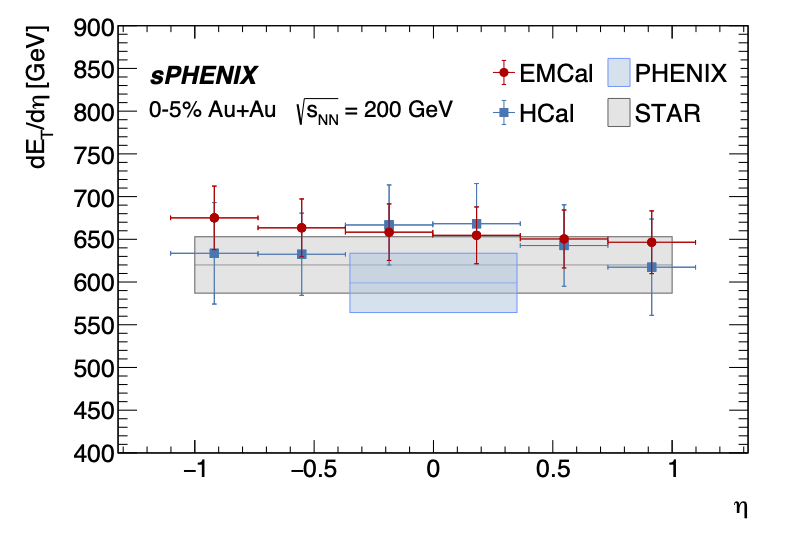
Measurement of dET/dη in 0-5 central Au+Au events using only EMCal (red points) and only HCal (blue points), as a function of η over the range |η| < 1.1. The vertical error bars show the total systematic uncertainty. The measurements from PHENIX [4] (blue box) and STAR [5] (gray box) in this centrality interval are shown for comparison, with the vertical and horizontal size of the box indicating the total uncertainty and the measurement range in η, respectively. |
Figure 6 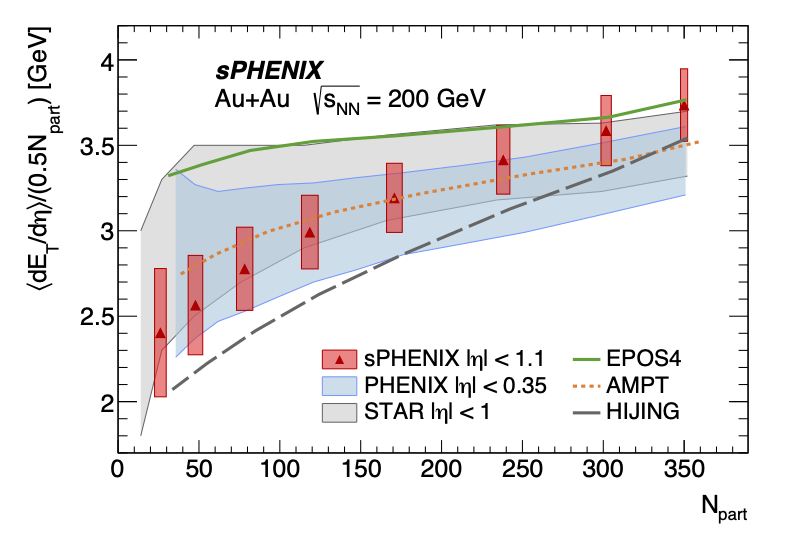
Measured dET/dη normalized by the estimated number of participant pairs (0.5Npart), as a function of Npart, using the full calorimeter system (red triangles). The vertical size of the boxes indicates the total uncertainty, which includes the uncertainty in Npart. Measurements by PHENIX [4] (blue band) and STAR [5] (gray band) are shown for comparison, with the vertical size of the band indicating the uncertainty range. MC event generator predictions are shown for EPOS4 (solid green line), AMPT (dotted orange line), and HIJING (dashed black line). |