Date: 2 April 2025
Tag: sPH-CONF-JET-2025-01
Document: Conference Note
(Back to sPHENIX Public Results page.)
Figure 1 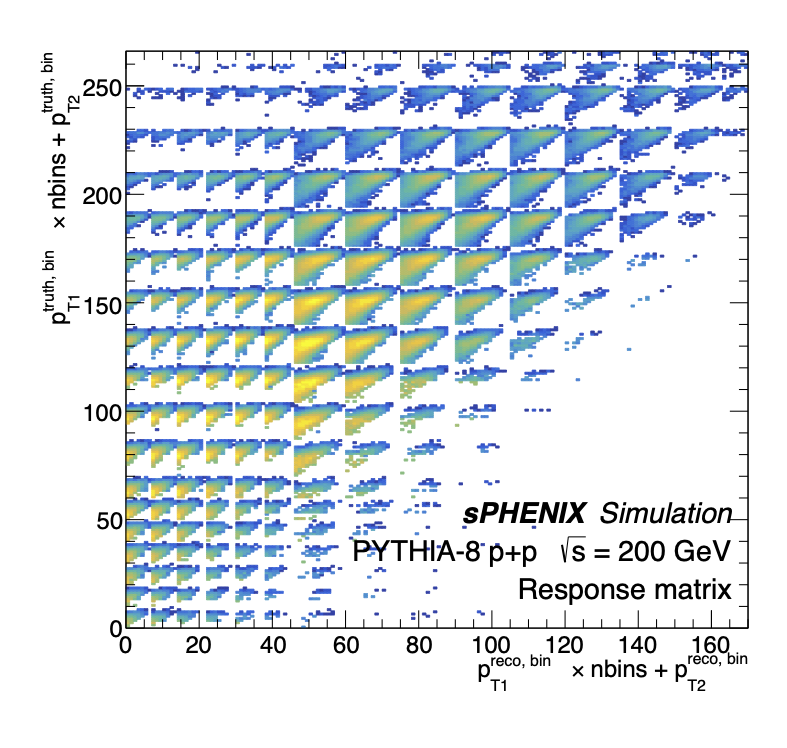
Response matrix trained with PYTHIA-8 and the sPHENIX reconstruction chain. |
Figure 2 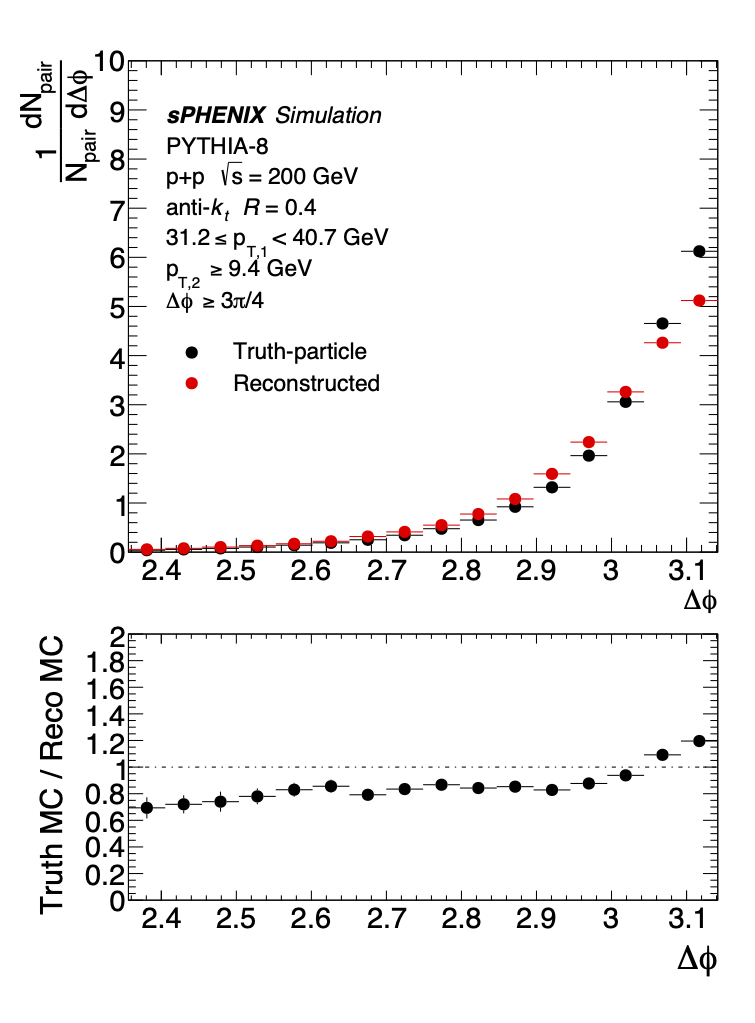
(Top) Δφ of reconstruction-level and truth-level PYTHIA-8 dijets in the leading pT1 bin 31.2 ≤ pT1 < 40.7 GeV selection. (Bottom) Correction factor applied to Δφ distribution in data. |
Figure 3 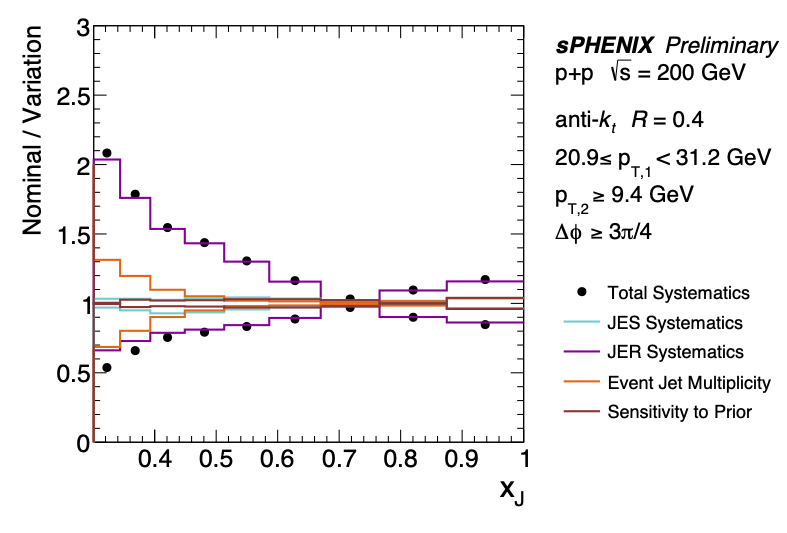
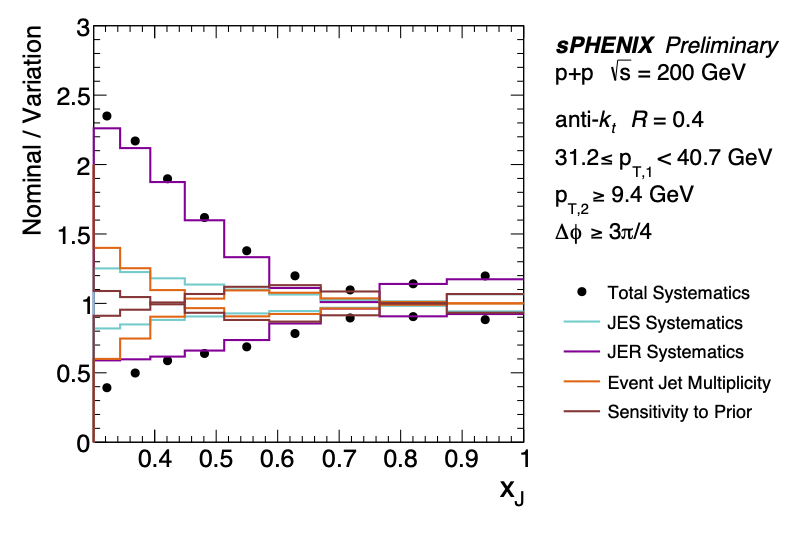
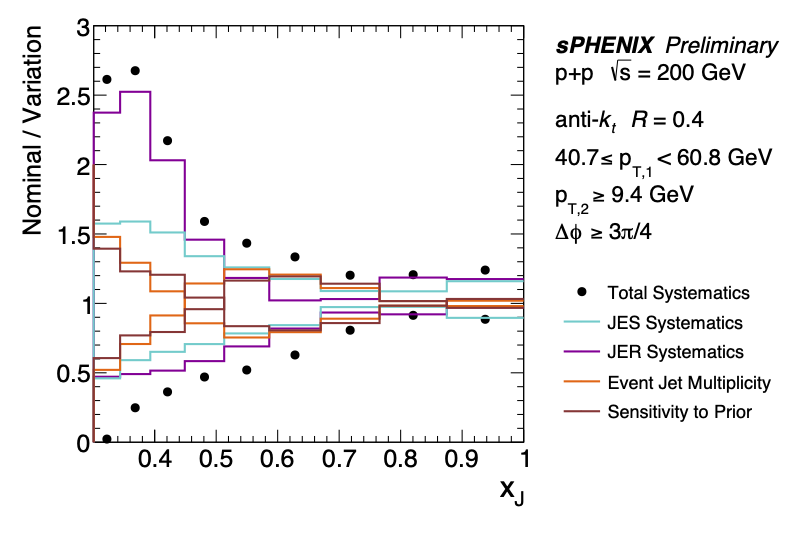
Total Systematic Uncertainties in xJ for three selections on pT1. |
Figure 4 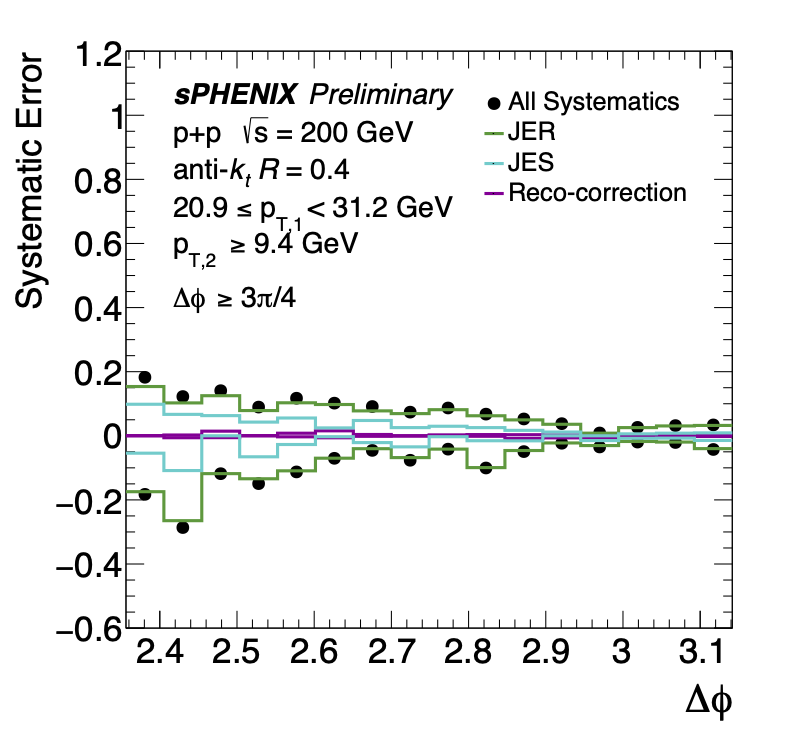
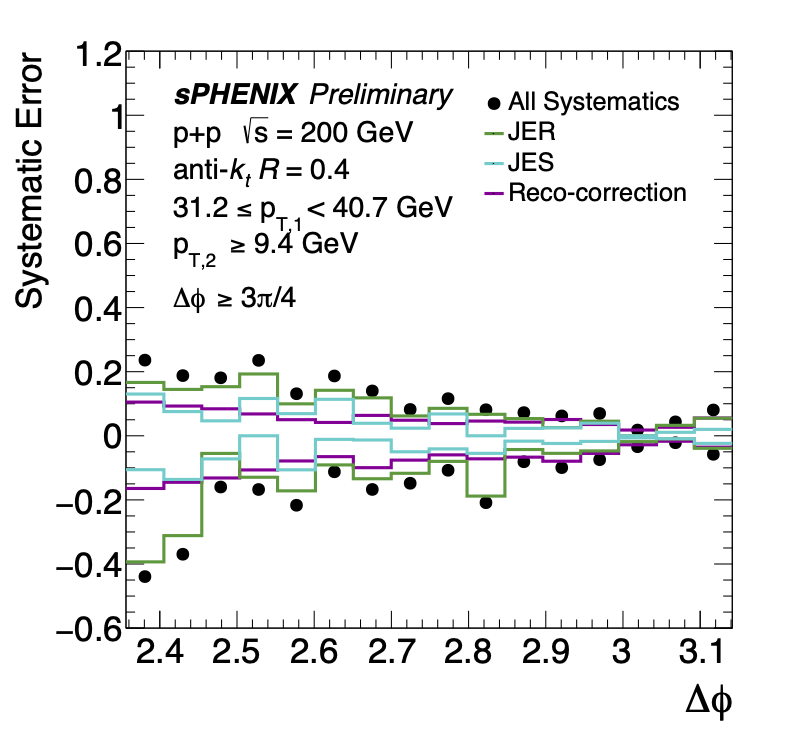
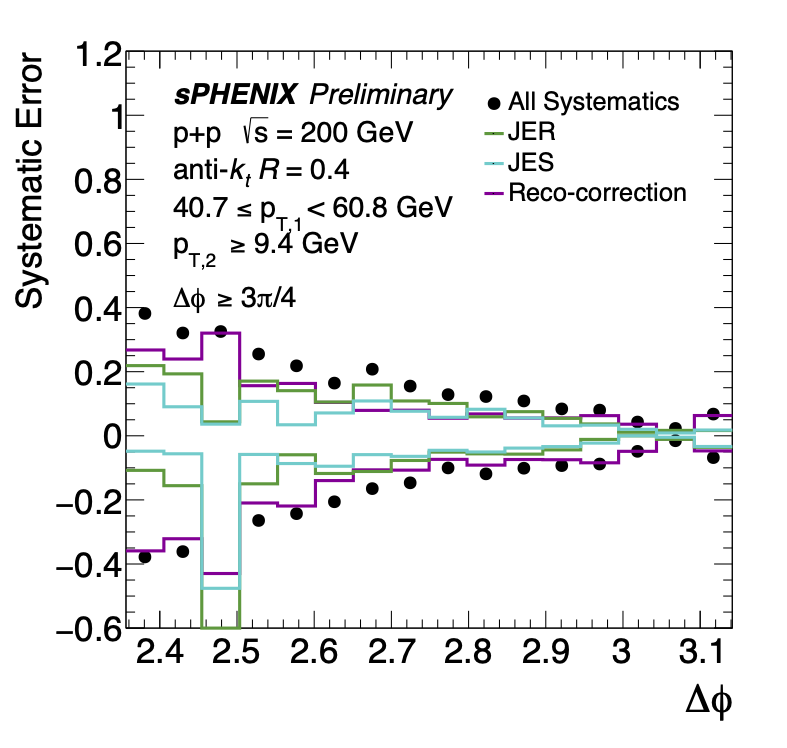
Total systematic uncertainties of the three pT1 selection in Δφ. |
Figure 5 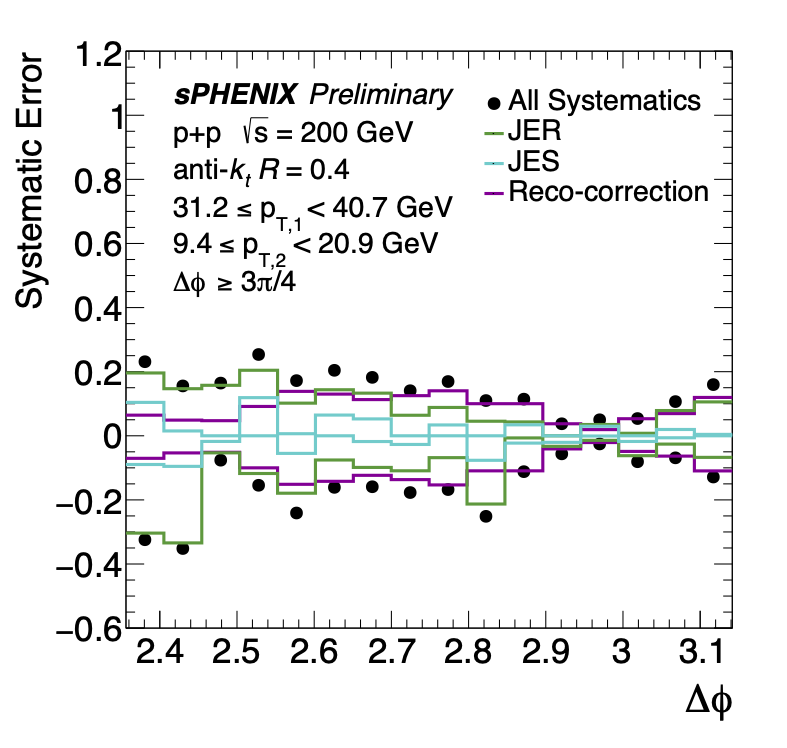
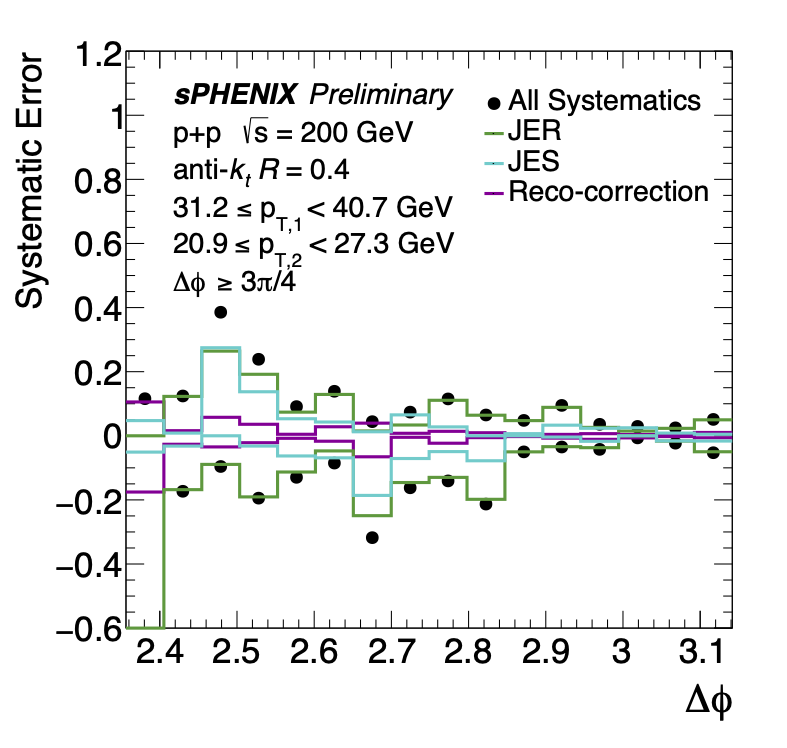
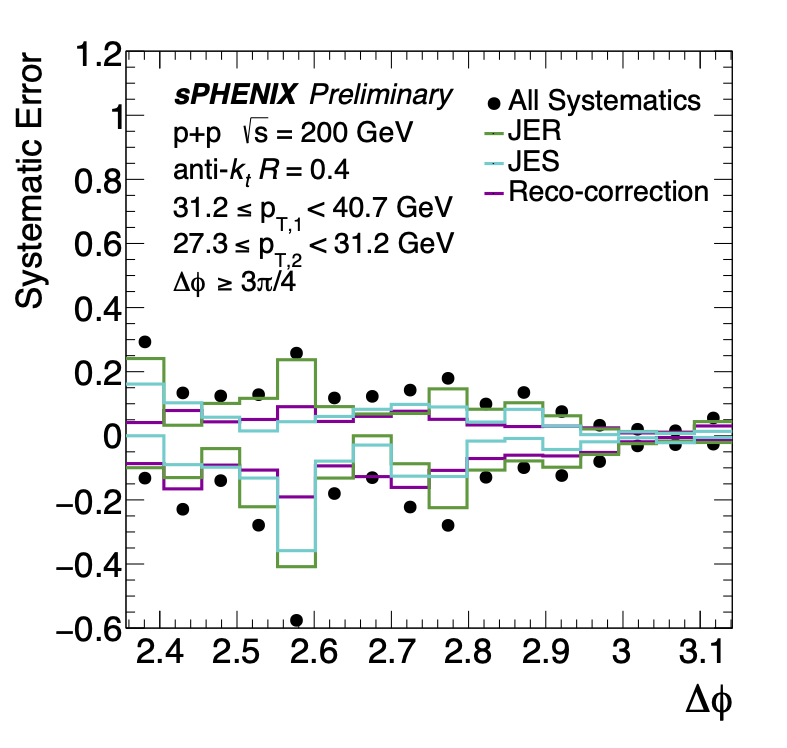
Total systematic uncertainties of the three pT2 selection in Δφ. |
Figure 6 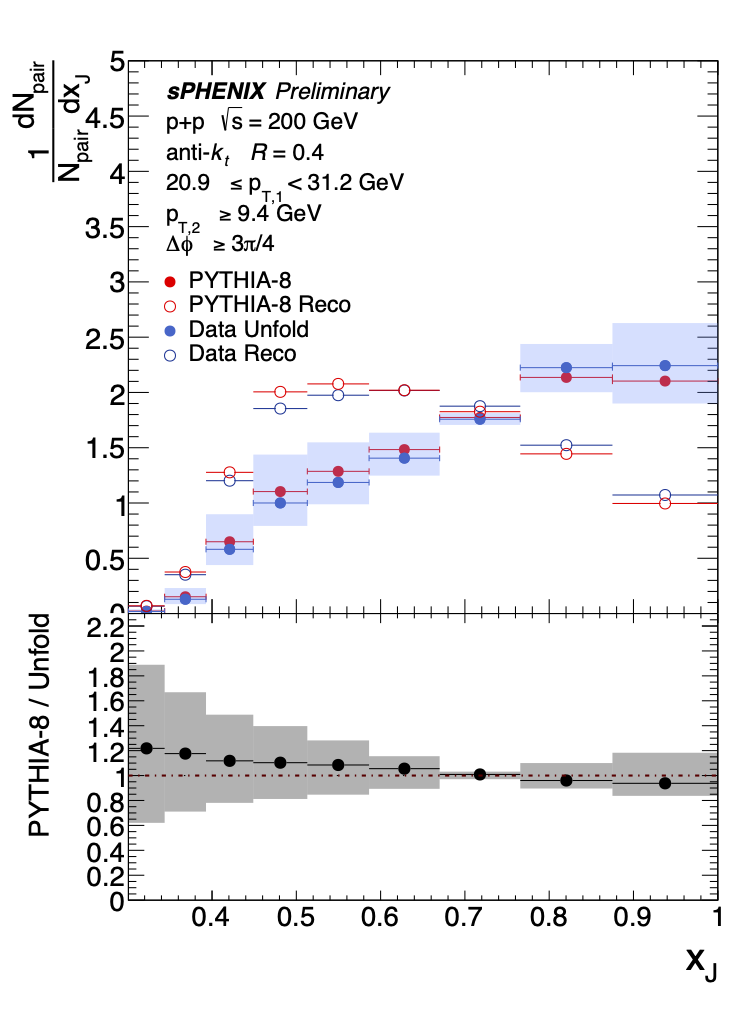
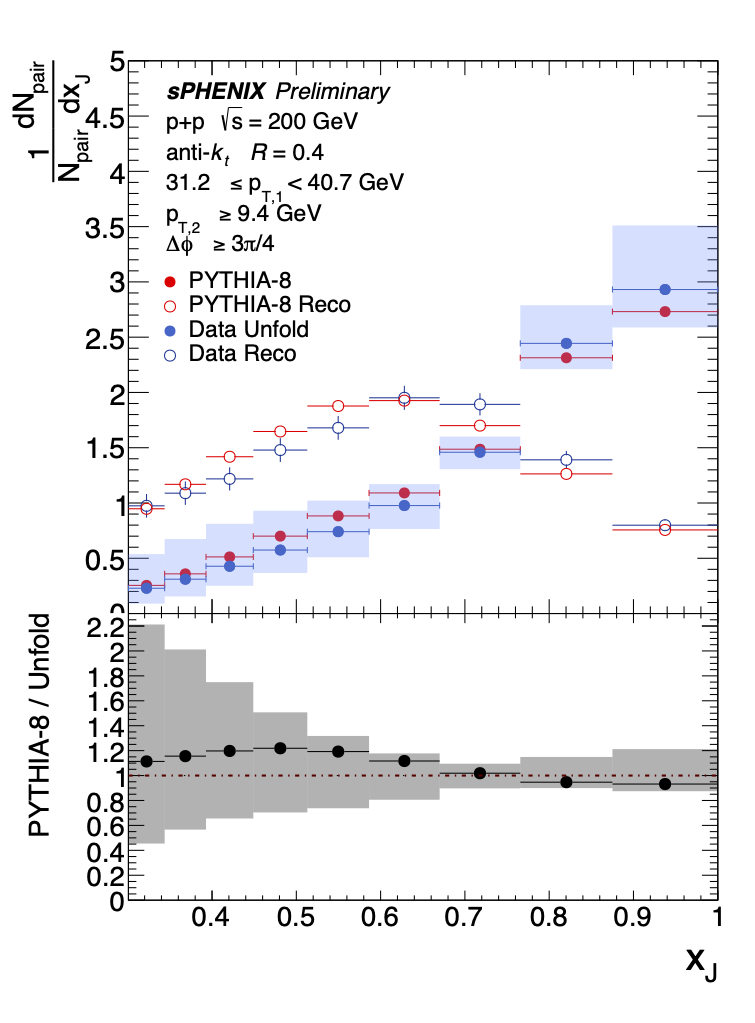
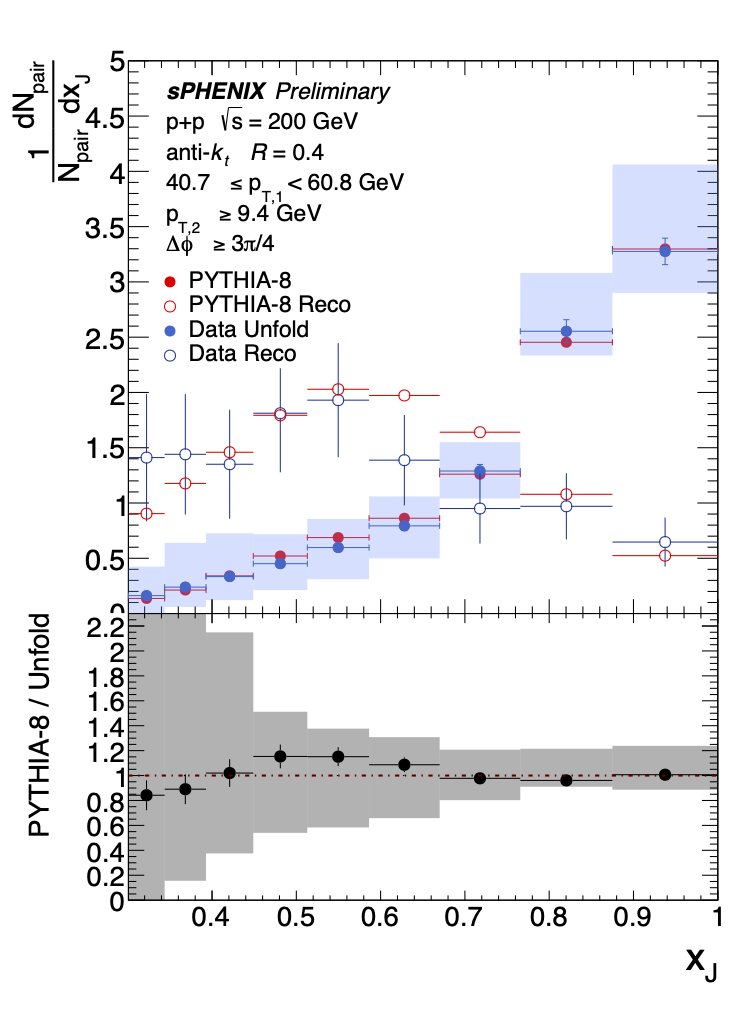
Reconstruction level and unfolded xJ distributions of dijet events in three leading jet pT1 bins. Statistical uncertainties are shown as vertical lines and systematic uncertainties as filled boxes. Also shown are results from PYTHIA-8 and the ratio of the PYTHIA-8 truth distribution to the unfolded data distribution in the lower panels. |
Figure 7 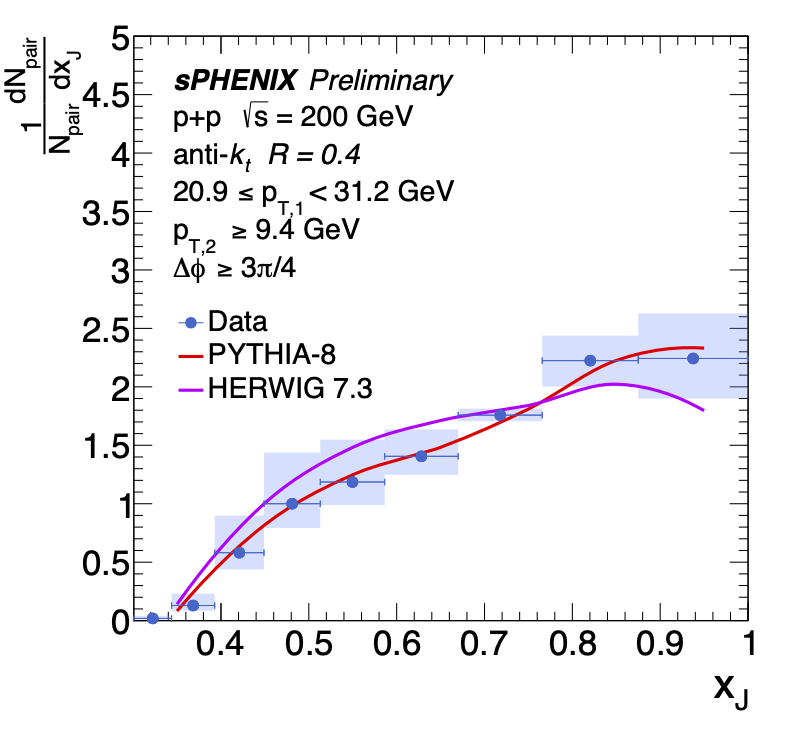
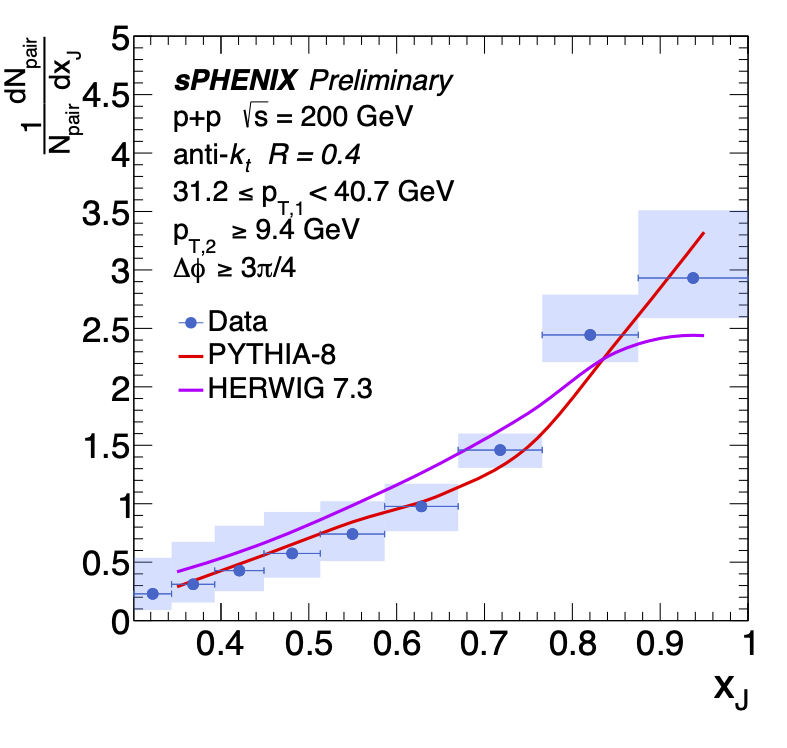
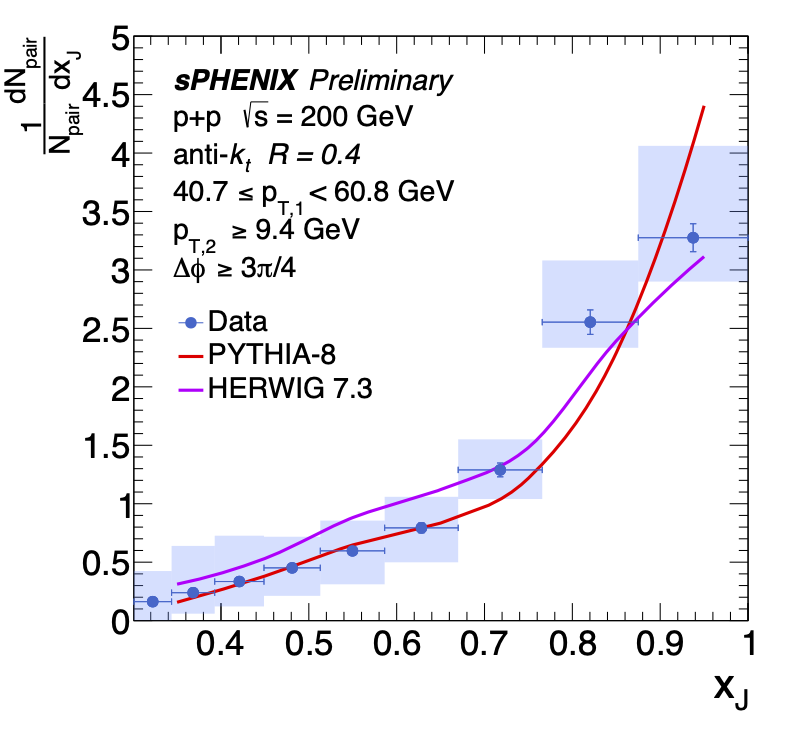
Fully unfolded xJ final results. Statistical uncertainties are shown as vertical lines and systematic uncertainties as filled boxes. PYTHIA-8 and HERWIG-7.3 generator results are also shown. |
Figure 8 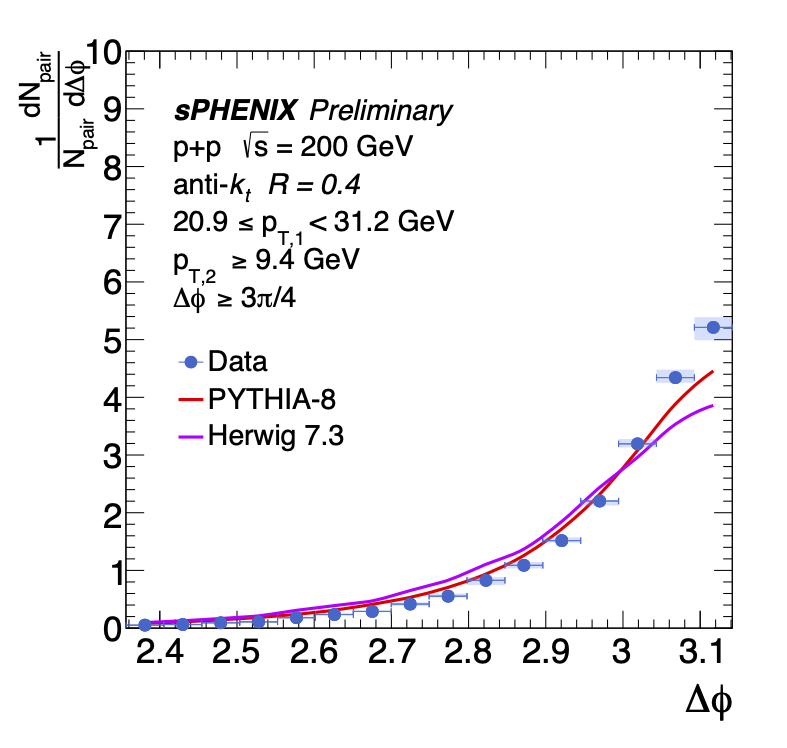
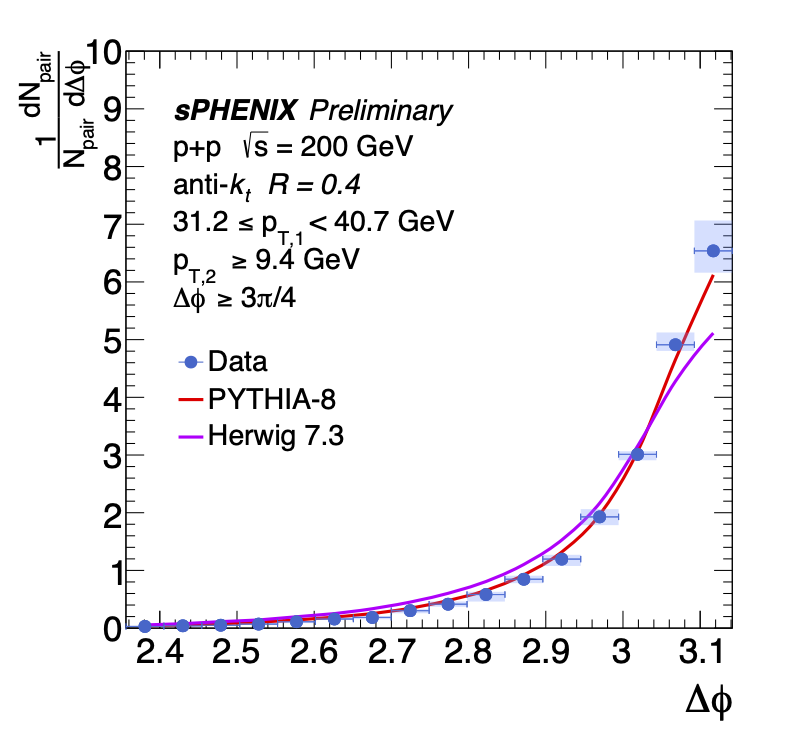
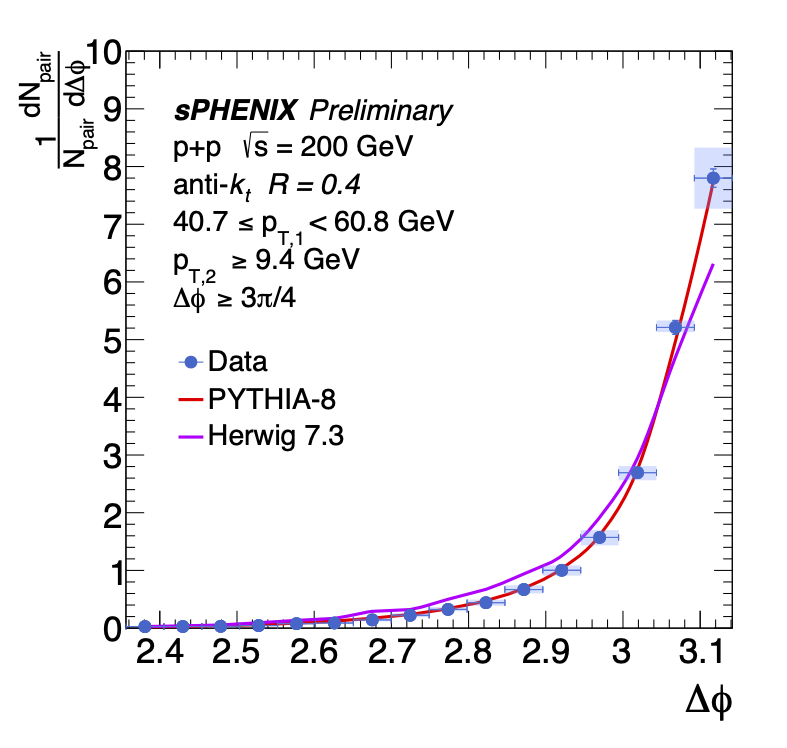
Δφ distributions for the three pT1 selections. Statistical uncertainties are shown as vertical lines and systematic uncertainties as filled boxes. PYTHIA-8 and HERWIG-7.3 generator results are also shown. |
Figure 9 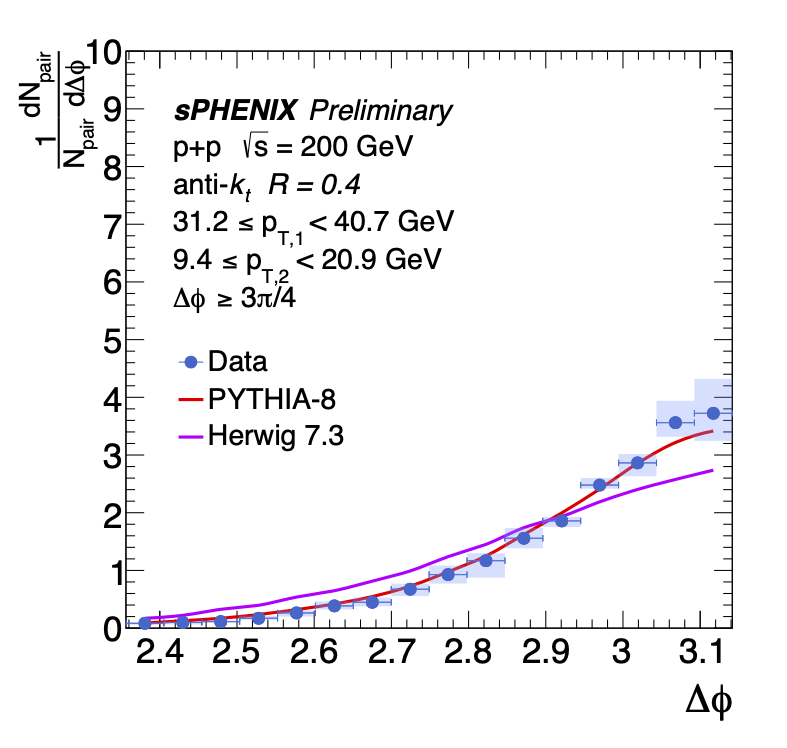
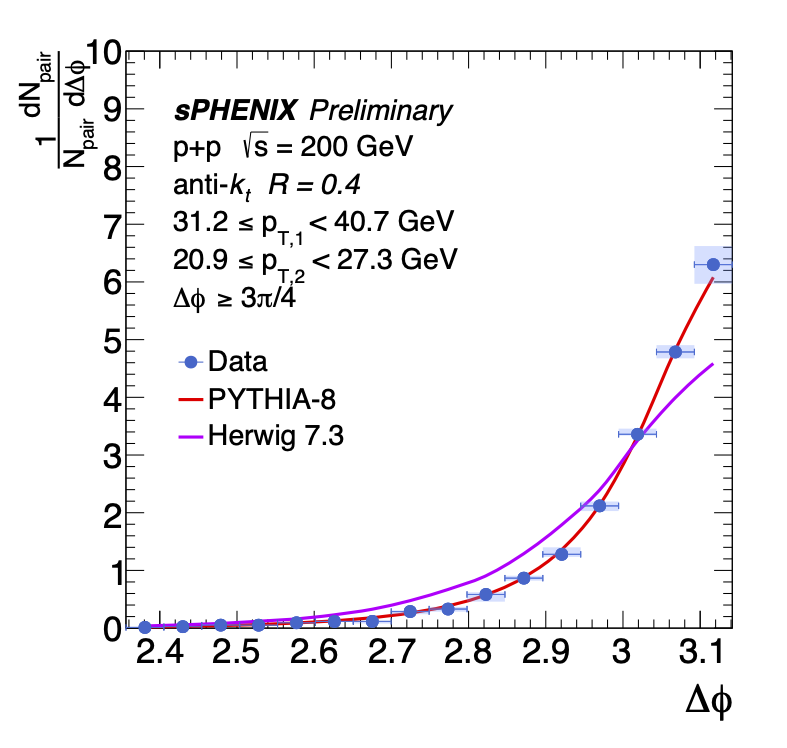
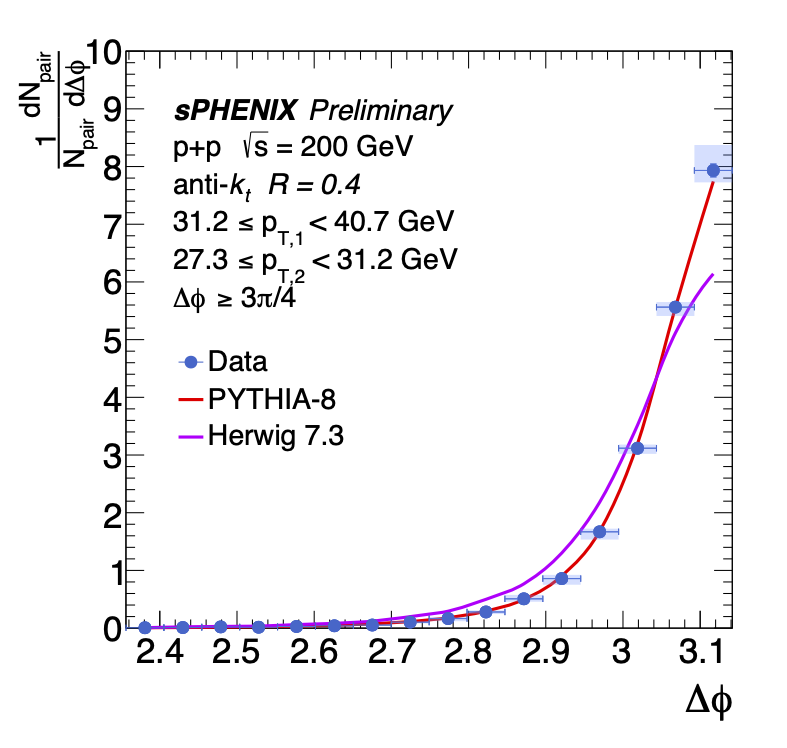
Δφ distributions for the three pT2 selections with the middle pT1 selection. Statistical uncertainties are shown as vertical lines and systematic uncertainties as filled boxes. PYTHIA-8 and HERWIG-7.3 results are also shown. |
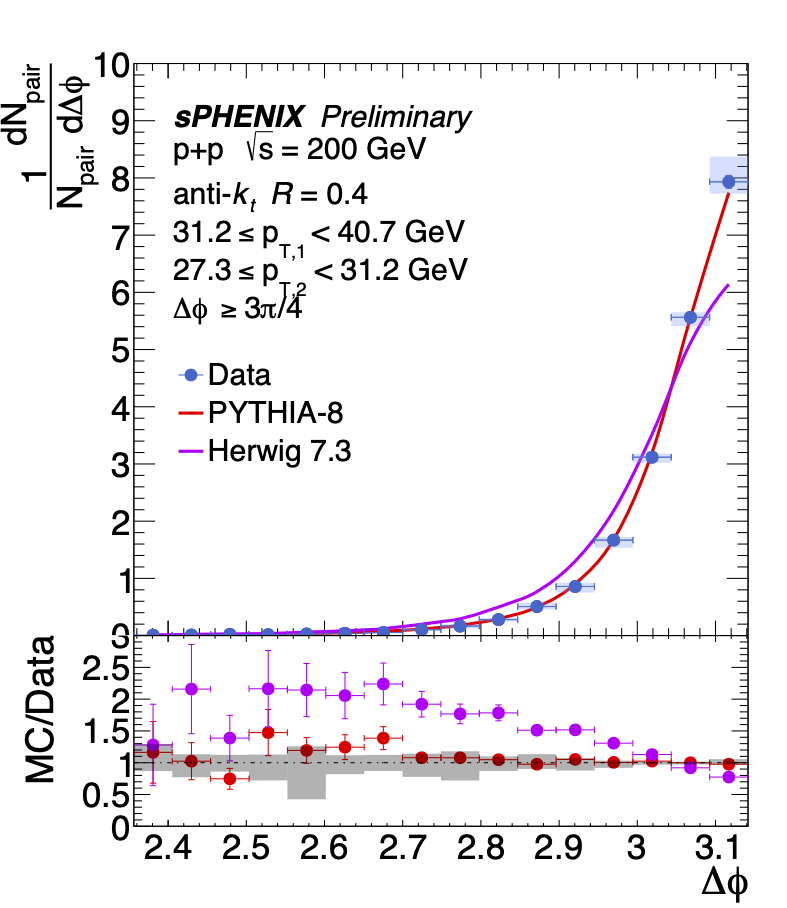
Figure 10 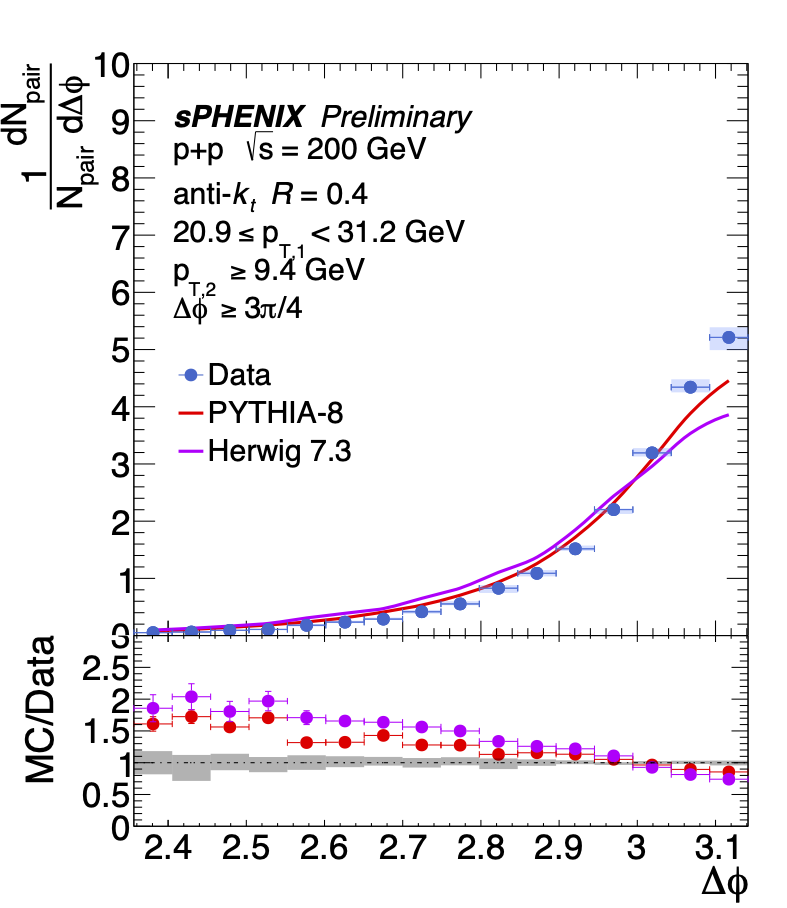
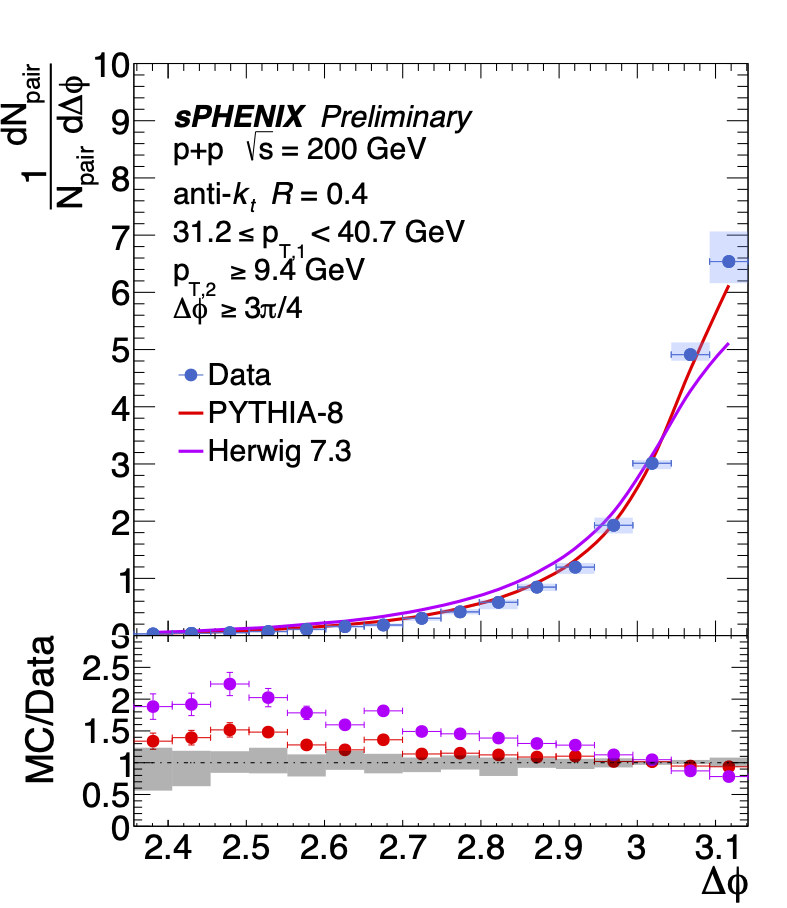
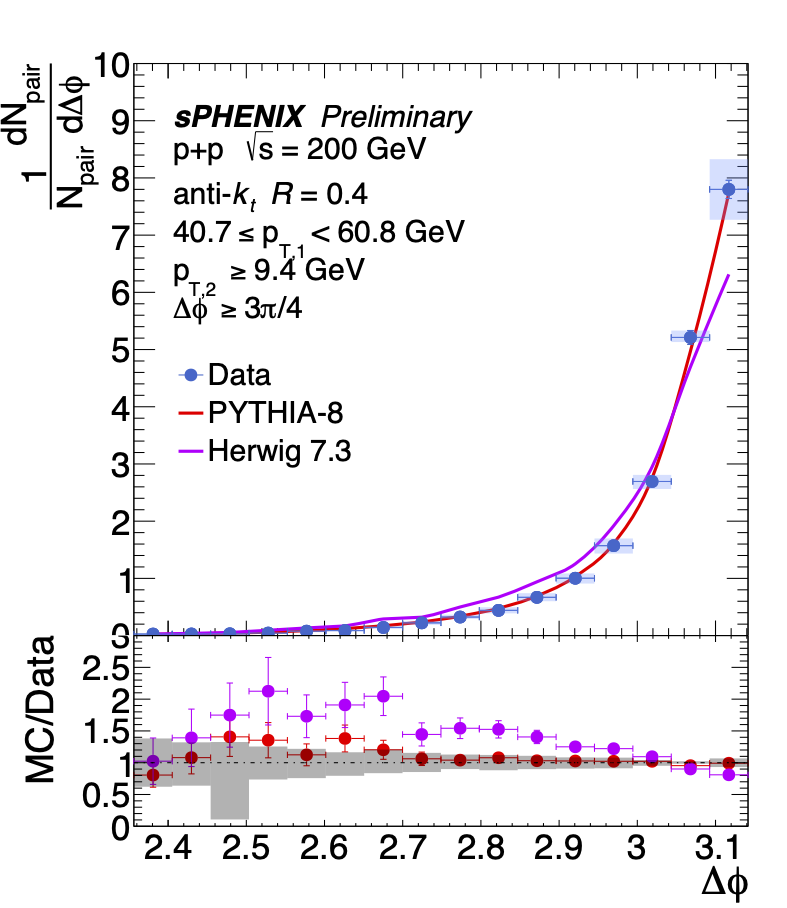
Δφ distributions for the three pT1 selections. Statistical uncertainties are shown as vertical lines and systematic uncertainties as filled boxes. PYTHIA-8 and HERWIG-7.3 generator results are also shown. Ratio of each generator to the data is shown on the bottom panel. |
Figure 11 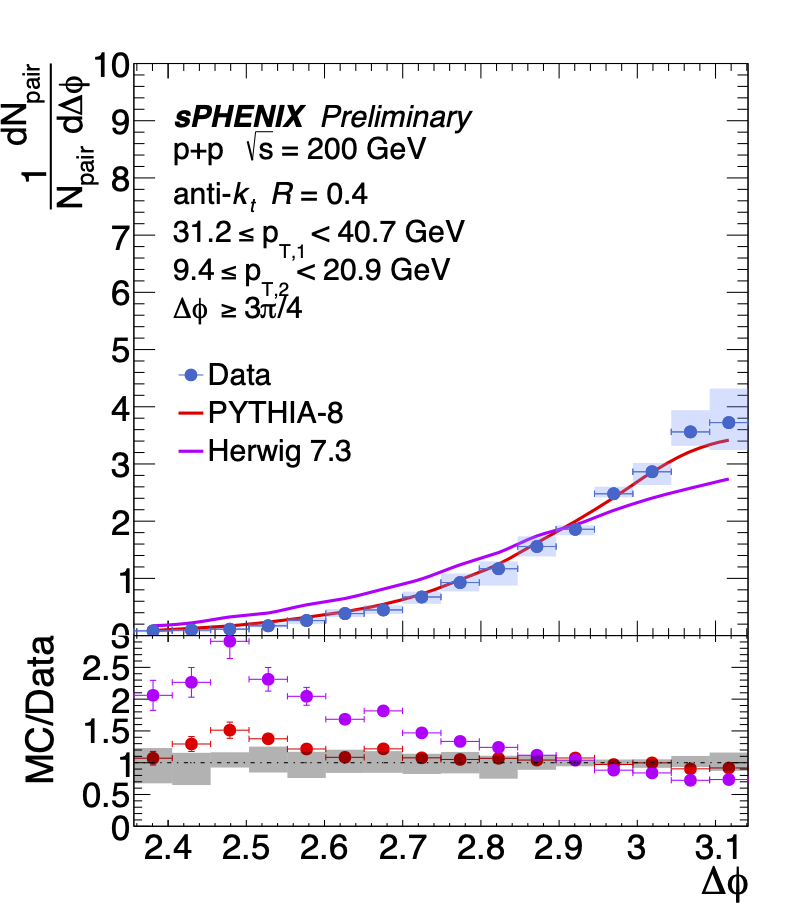
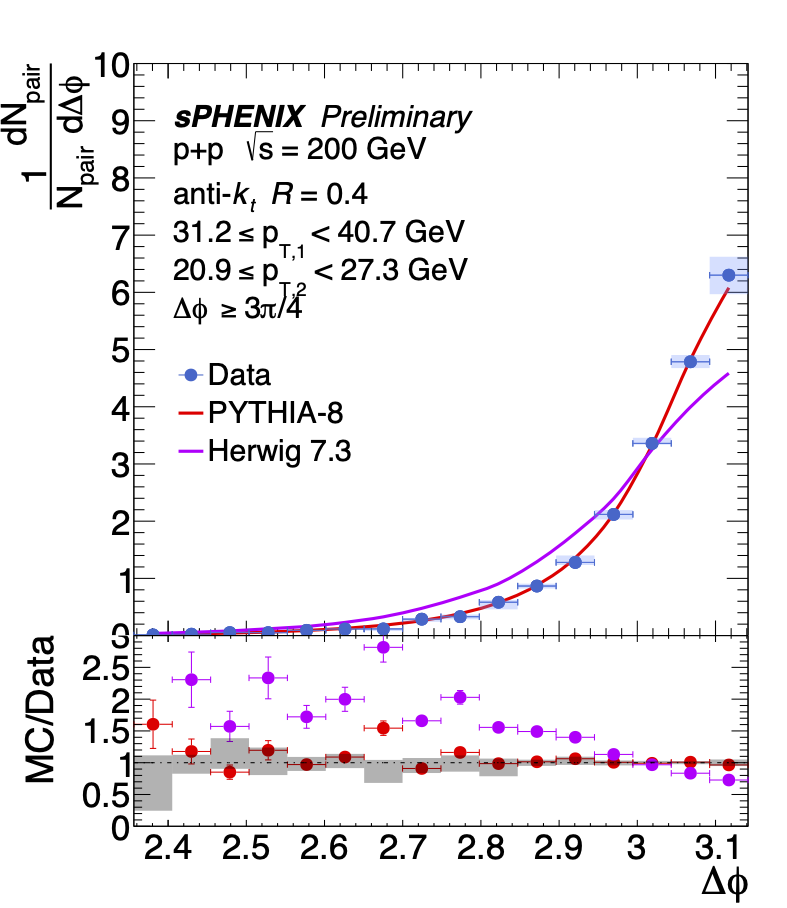
Δφ distributions for the three pT2 selections with the middle pT1 selection. Statistical uncertainties are shown as vertical lines and systematic uncertainties as filled boxes. PYTHIA-8 and HERWIG-7.3 results are also shown. Ratio of each generator to the data is shown on the bottom panel. |
Figure 12
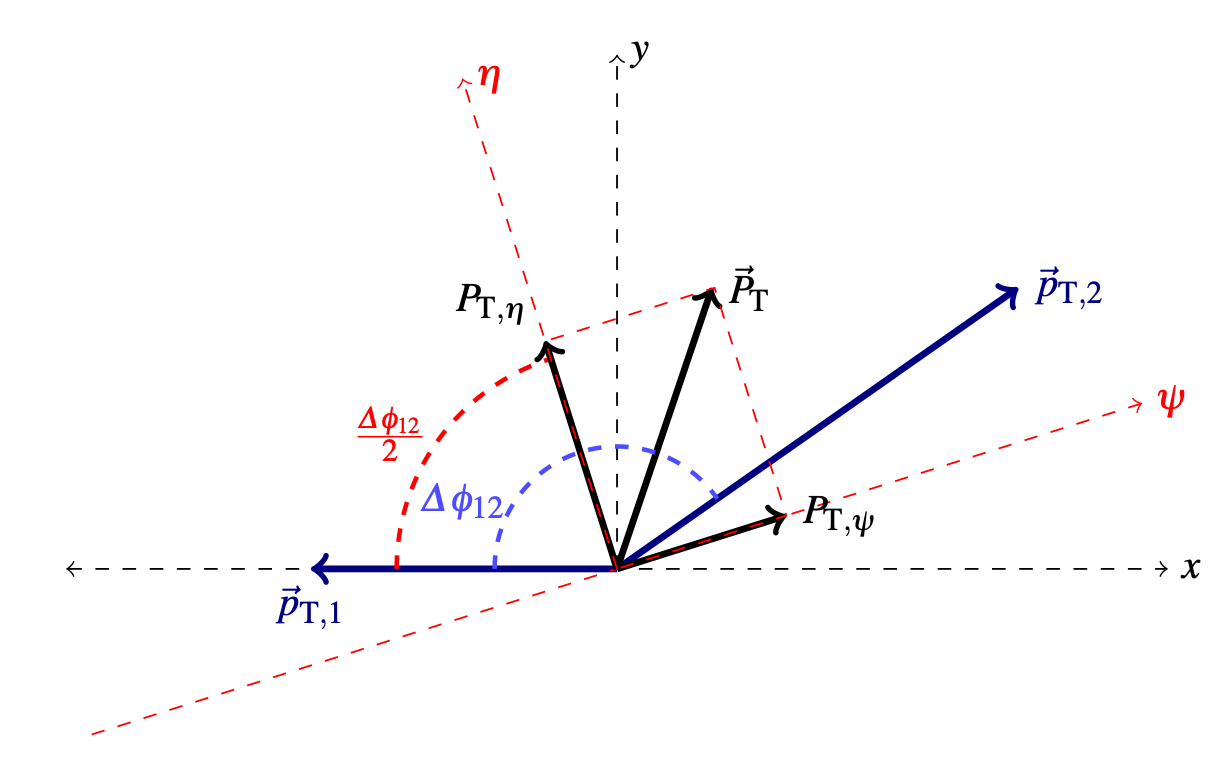
Diagram of leading vec(pT1) and subleading vec(pT2) jets in the coordinate system used for the bisector method (reproduced from Ref. [29]). |
Figure 13 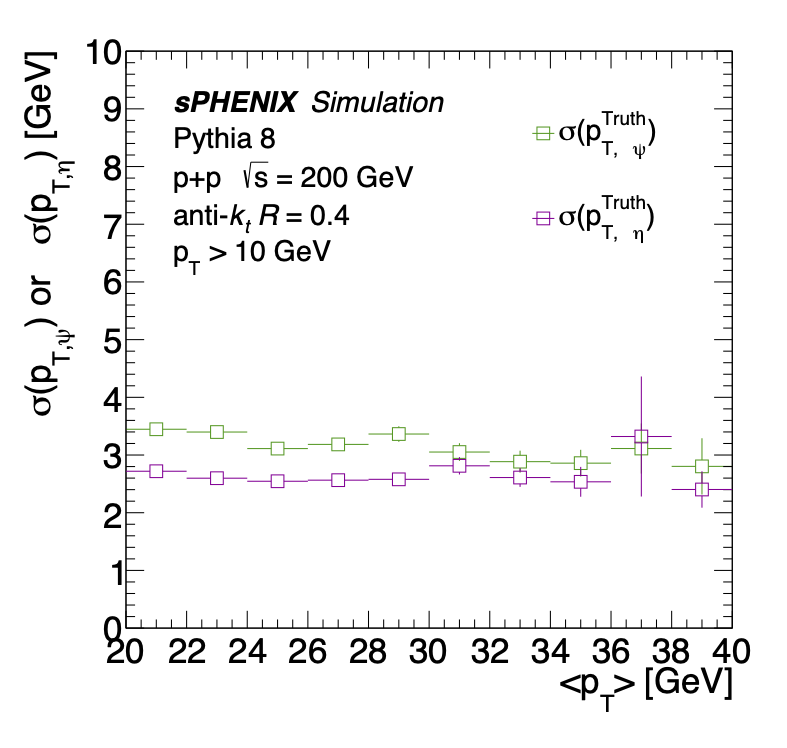
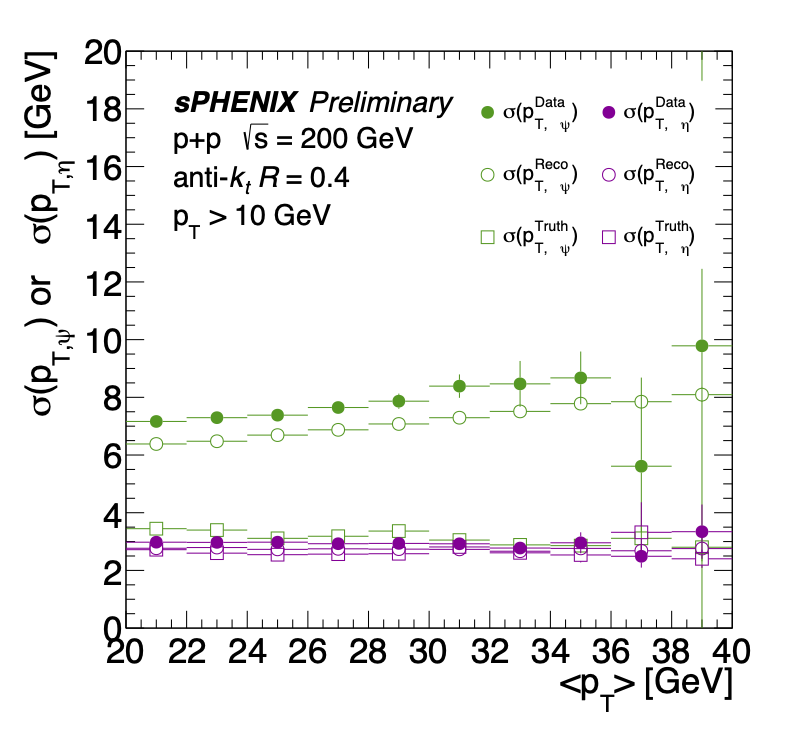
(Left) PYTHIA-8 truth dijet σ(pTψ) and σ(pTη) as a function of <pT> and (right) includes σ(pTψ) and σ(pTη) in reconstructed PYTHIA-8 jets and data. |
Figure 14 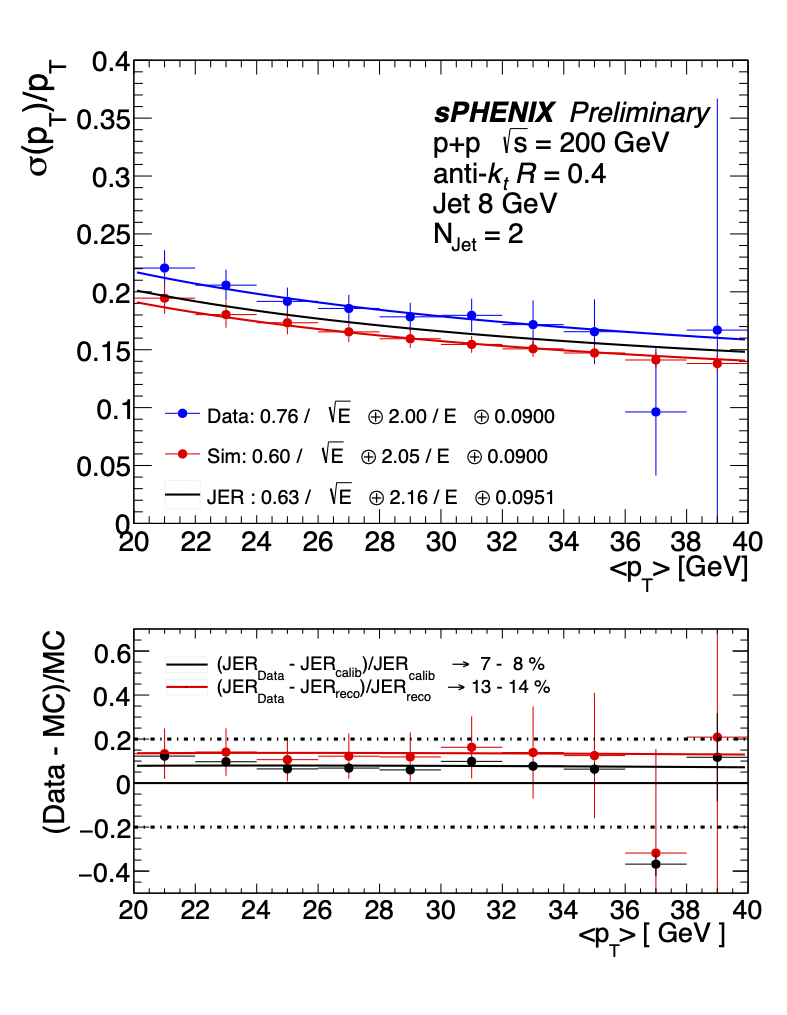
(top) Jet energy resolution in data and simulation derived form the bisector method as a function of average pT with fits and the JER function retrieved from simulation based calibration. (Bottom) The ratio of each average pT bin in Data and MC as well as the ratio of the fit to the data to the calibration result of the JER function. |