Date: 3 April 2025
Tag: sPH-CONF-JET-2025-02
Document: Conference Note
(Back to sPHENIX Public Results page.)
Figure 1 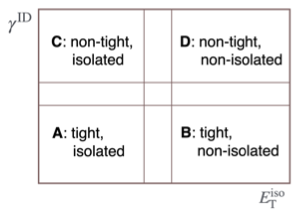
Diagram of the signal region (A) and sideband regions (B, C, D). |
Figure 2 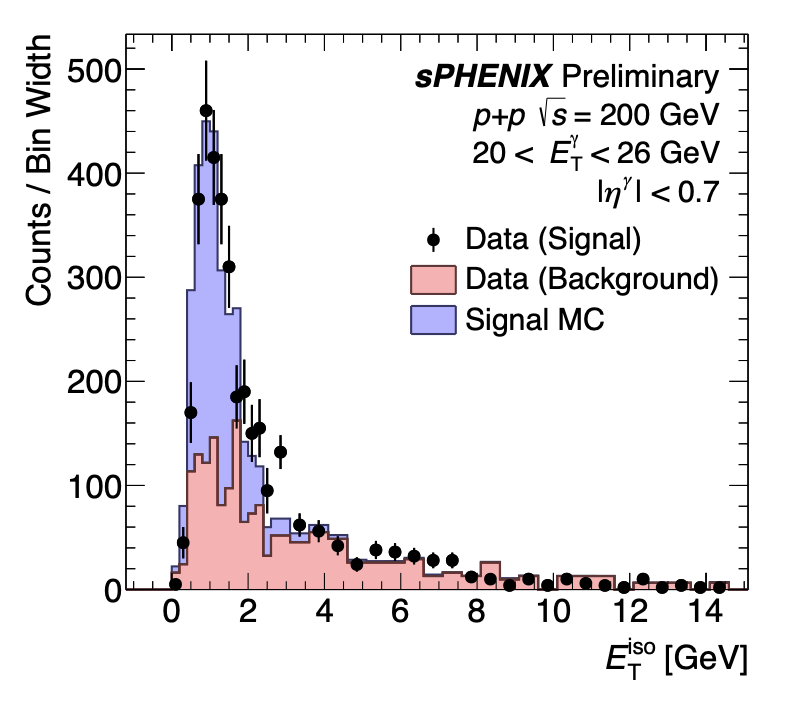
ETiso distributions of signal data with tight γID, background data with non-tight γID and signal MC with tight γID. The background data and signal MC histograms are stacked. |
Figure 3 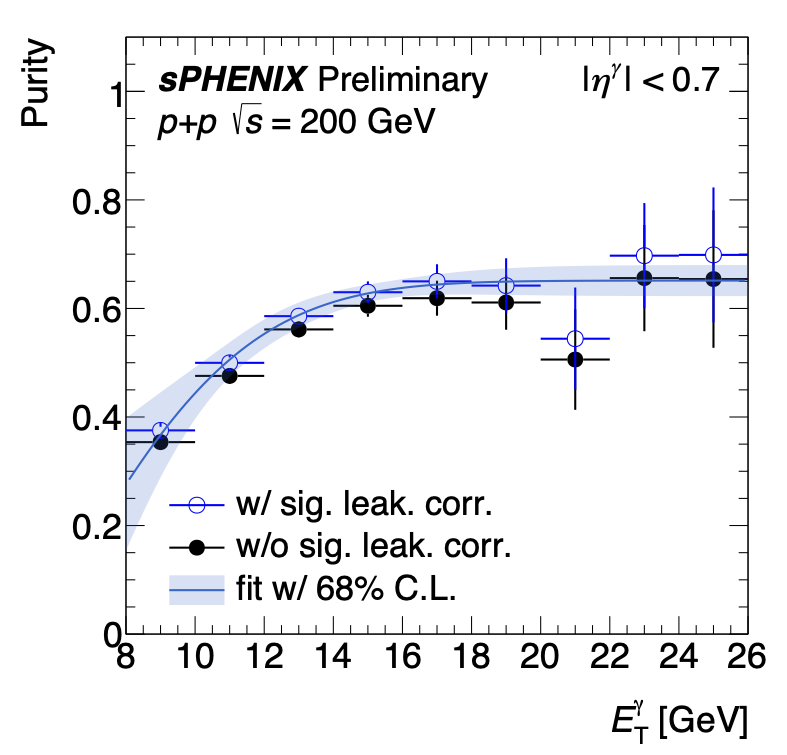
Purity as a function of ETγ with and without signal leakage correction in data. The purity with leakage correction is fitted by an error function, the shaded area shows the 68.3% confidence interval of the fit. |
Figure 4 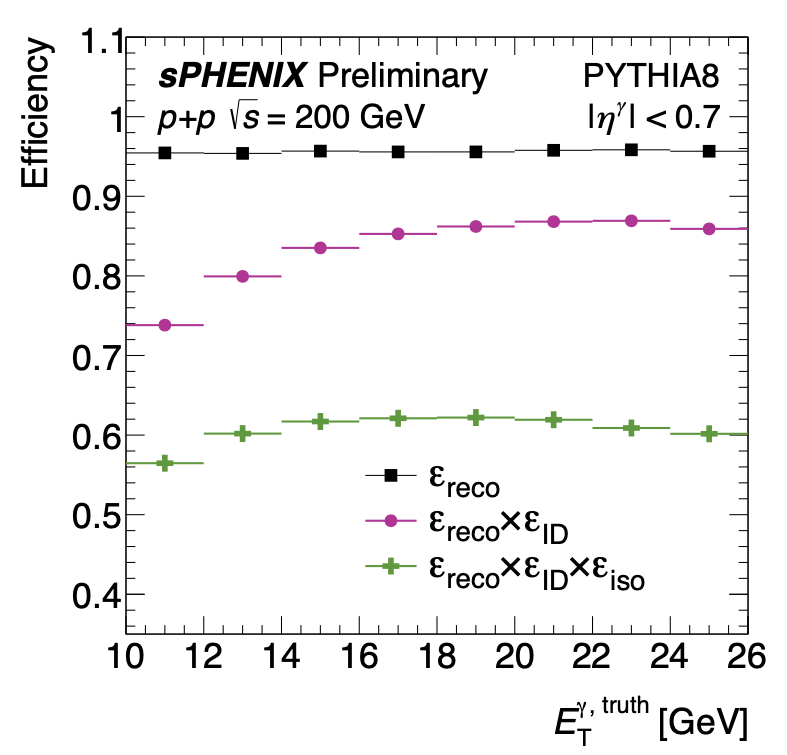
Efficiencies for reconstruction (εreco), identification (εID), isolation requirement (εiso), and convolved step-by-step efficiencies (εtot) as a function of truth photon ETγ,truth. |
Figure 5 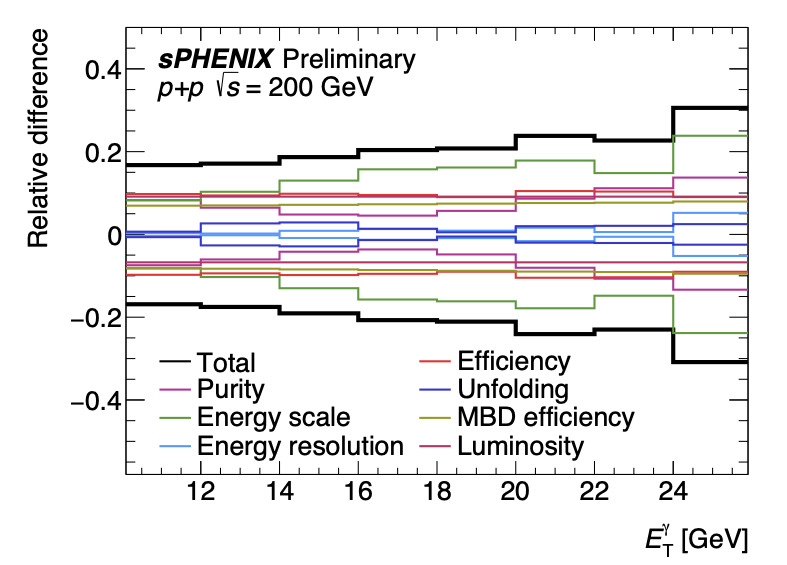
Breakdown of systematic uncertainties as a function of ETγ. |
Figure 6 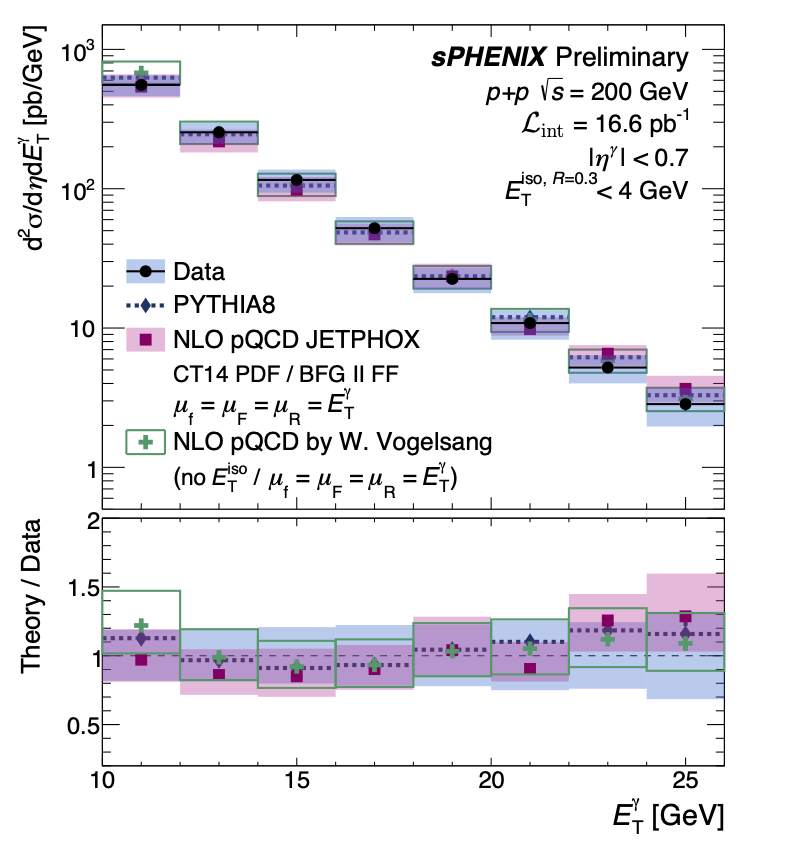
The differential cross-section of isolated prompt photons as a function of ETγ is compared with theoretical predictions of PYTHIA-8.307 (Detroit tune), JETPHOX and NLO pQCD calculations provided by Werner Vogelsang. The statistical uncertainties are plotted as vertical lines and the systematic uncertainties are plotted as shaded bands. The boxes around the JETPHOX points represent the systematic uncertainties obtained by varying μf = μF = μR to ETγ/2 and 2ETγ. The lower panel shows a theory-to-data ratio for PYTHIA-8, JETPHOX, and NLO pQCD calculations to this analysis, where the experimental systematic uncertainties are shown as shaded bands around unity. The theory and experimental statistical uncertainties are combined on the theory points. |
Figure 7 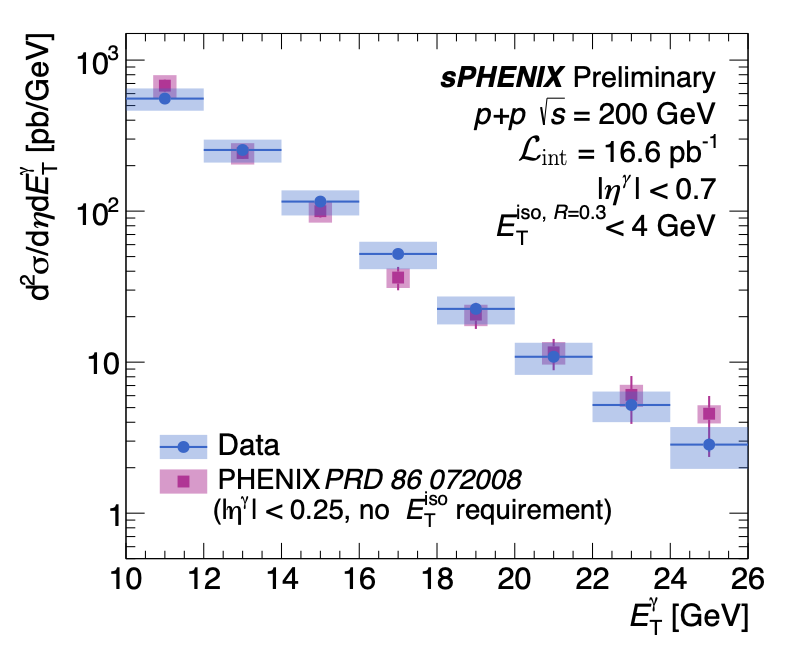
The differential cross-section of isolated prompt photons as a function of ETγ is compared with the PHENIX measurements [13] of direct photons. The statistical uncertainties are plotted as vertical lines and the systematic uncertainties are plotted as shaded bands. The PHENIX data points are not corrected for the full ETγ bin-width and instead represent the cross-section evaluated at the center of each bin. |