
Date: 20 June 2026
Tag: sPH-JET-2026-02
Document: arXiv preprint
(Back to sPHENIX Public Results page.)
Figure 1 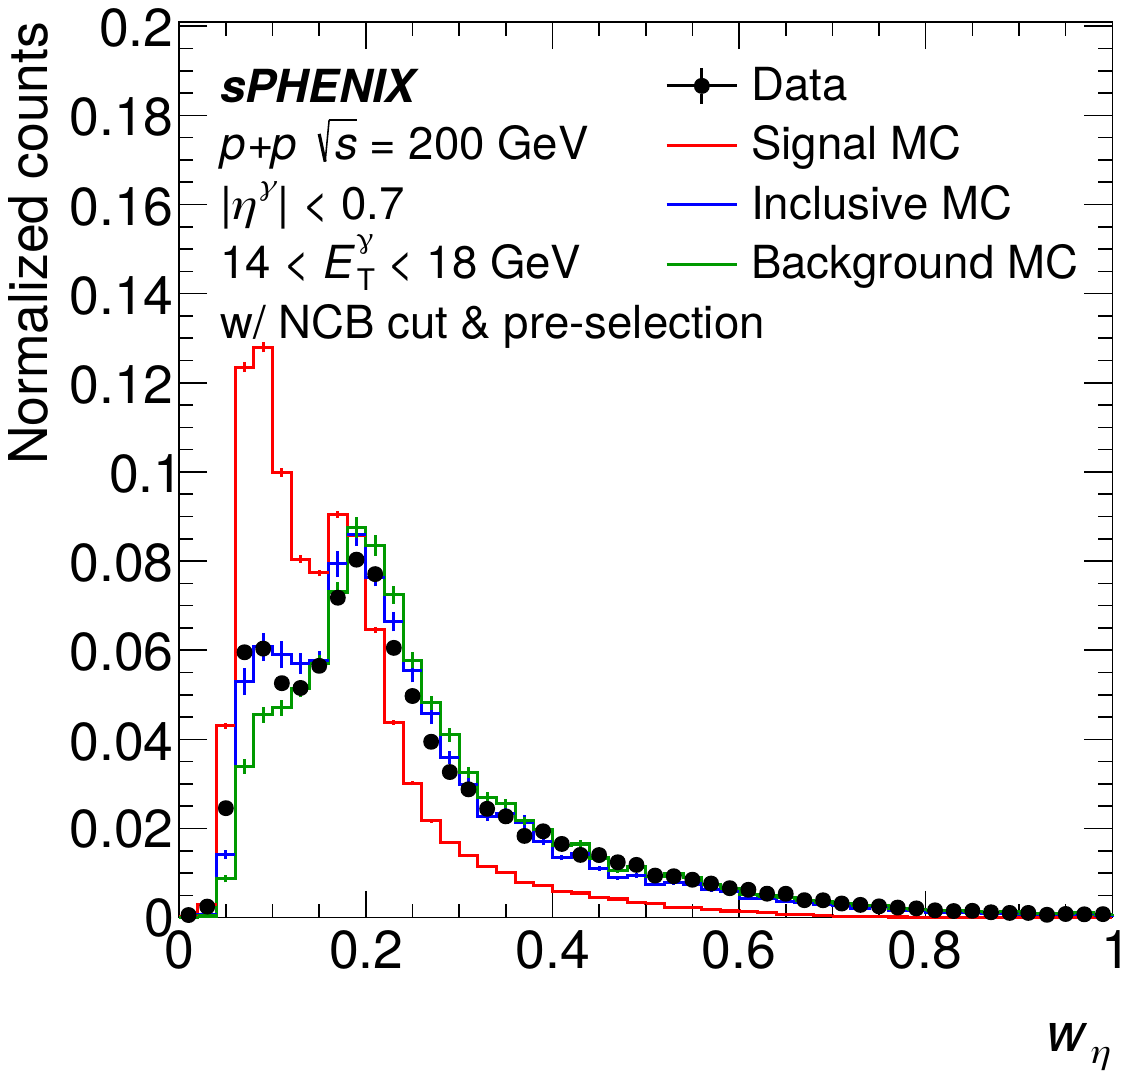
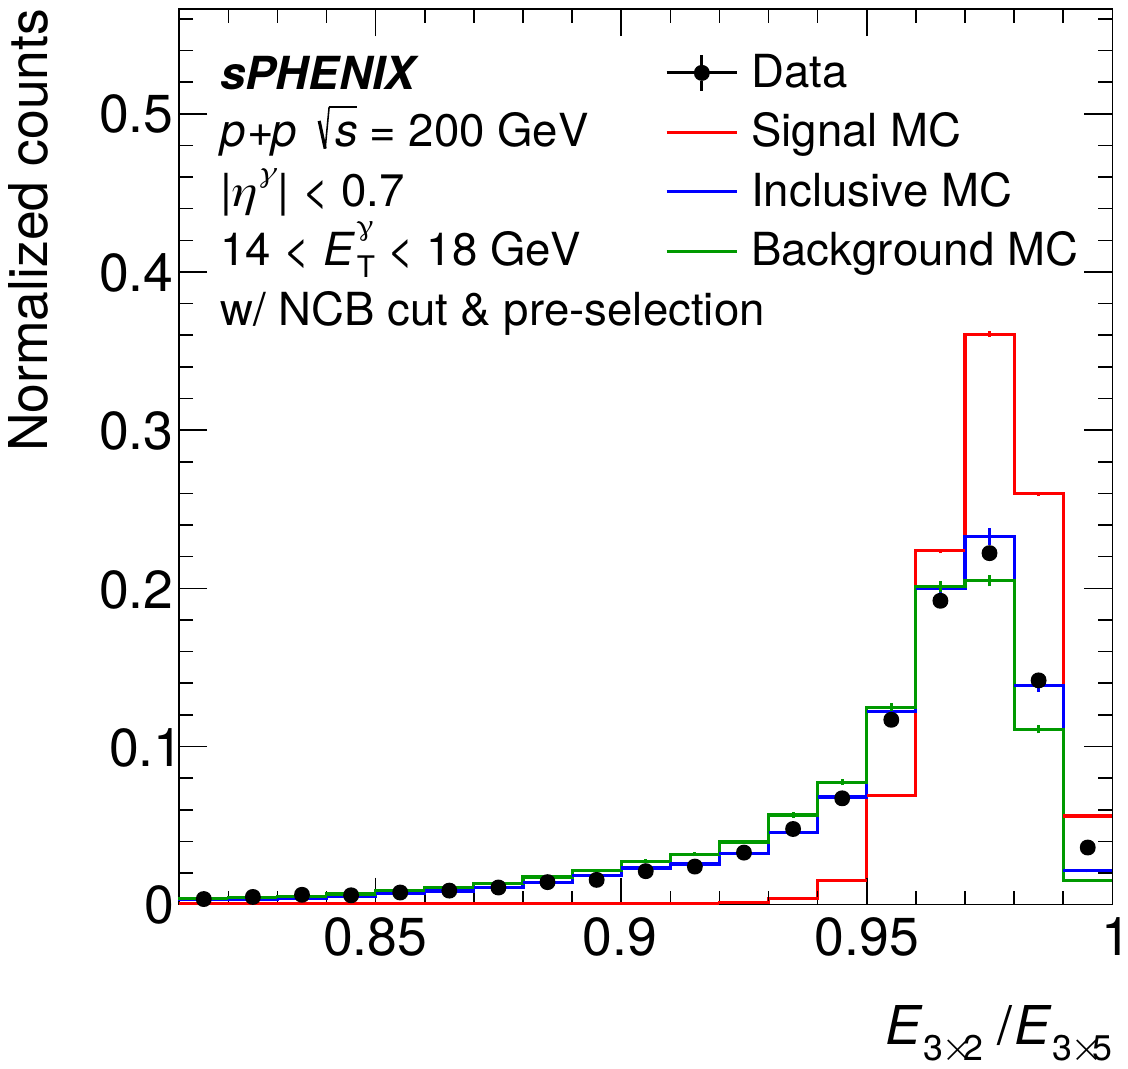
Distributions of the shower shape variables wη (left) and E3×2/E3×5 (right) after the non-collision background (NCB) and pre-selection requirements, before applying the photon identification selection, for 14 < ETγ < 18 GeV and |ηγ| < 0.7. Black points show data, the red histogram shows the prompt photon signal MC, the blue histogram shows the inclusive MC, and the green histogram shows the background MC. The data and MC distributions are normalized such that the integral is unity. |
Figure 2 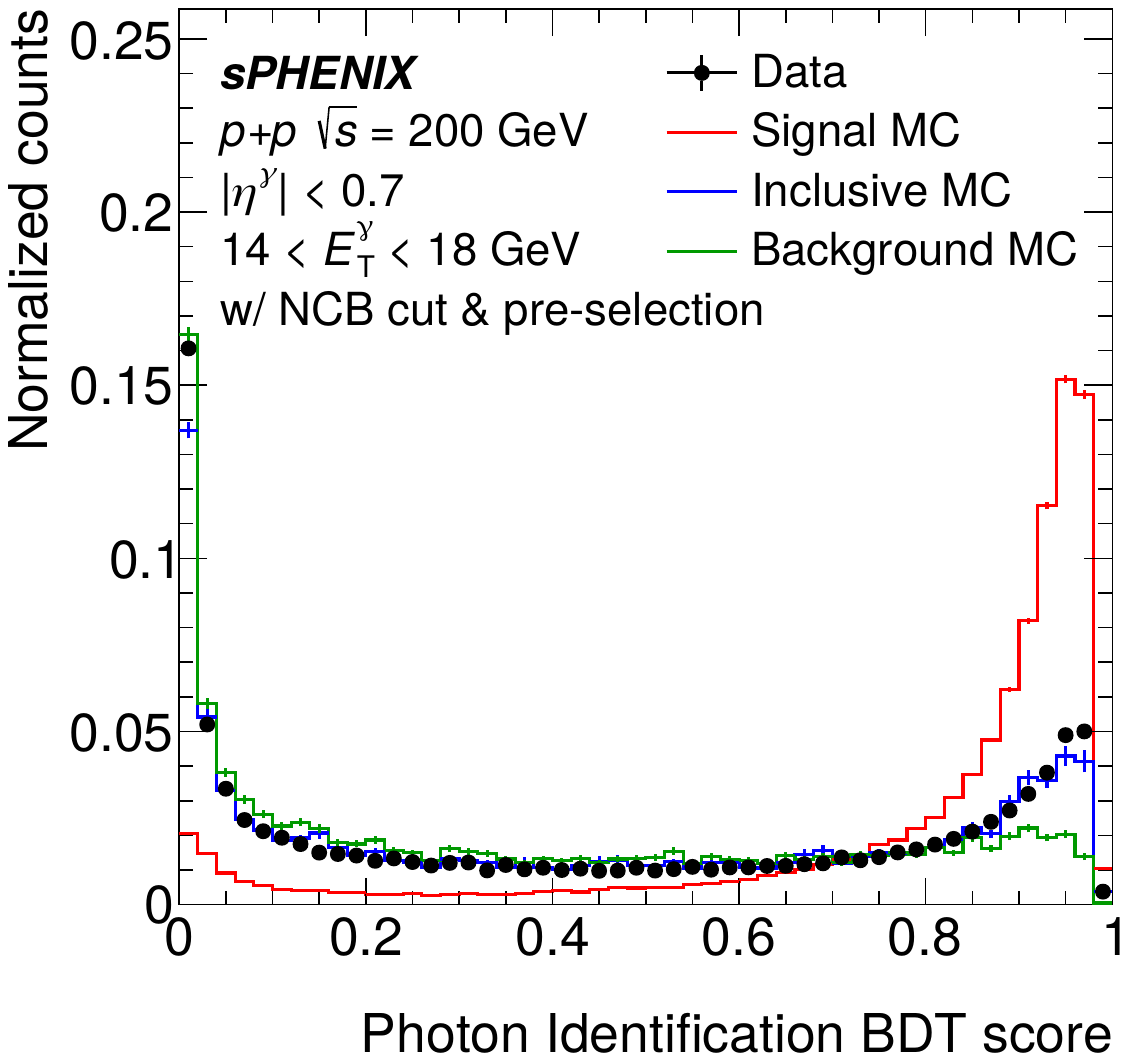
Distribution of the photon identification BDT score for data (black points), prompt photon signal MC (red), inclusive MC (blue), and background MC (green), after the NCB and pre-selection requirements, for 14 < ETγ < 18 GeV and |ηγ| < 0.7. The data and MC distributions are normalized such that the integral is unity. |
Figure 3 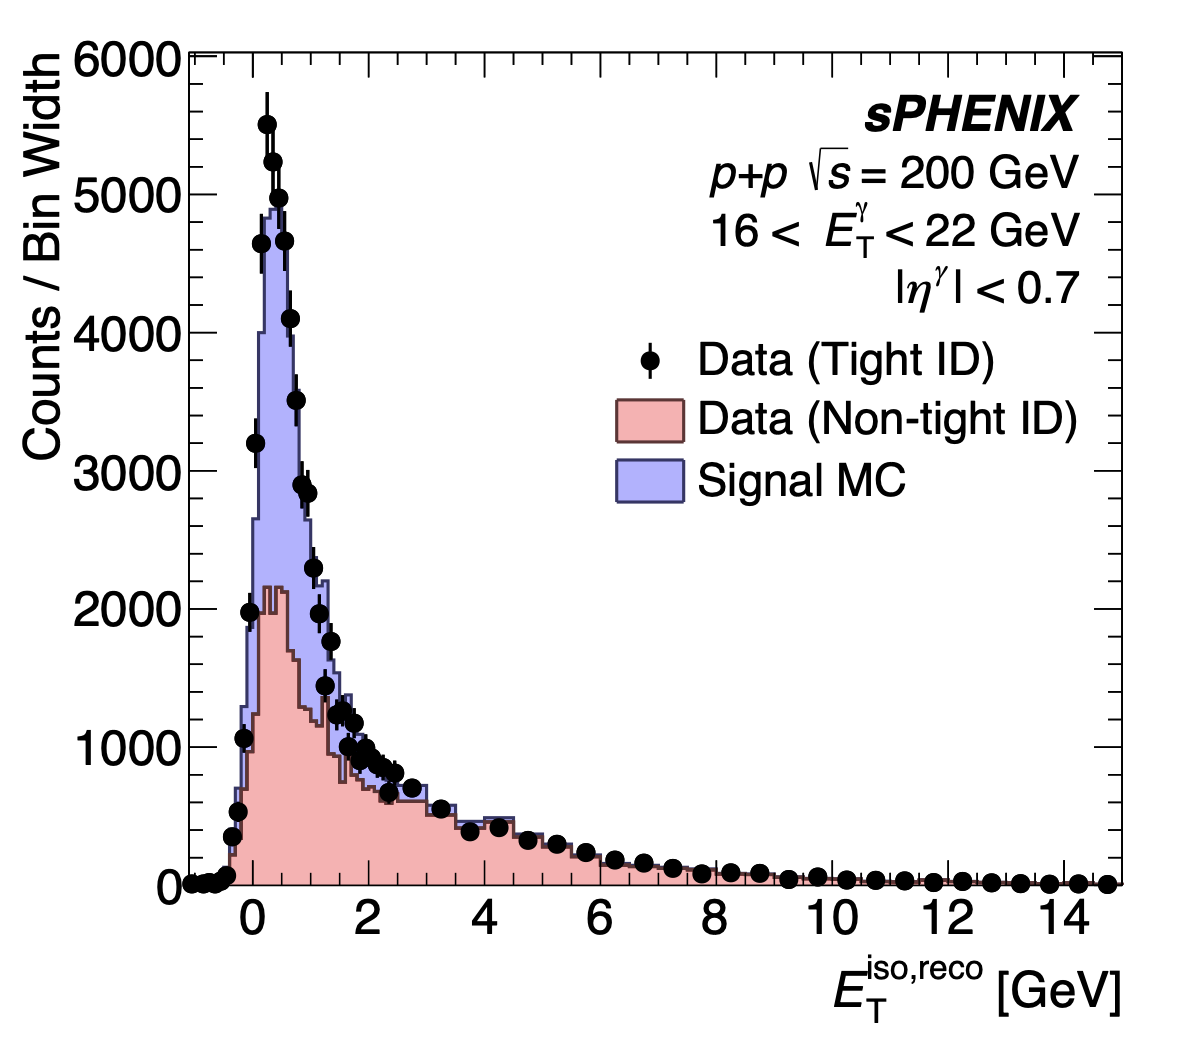
ETiso,reco distributions of signal-enriched data with tight γID, background-enriched data with non-tight γID, and signal MC with tight γID. The background-enriched data and signal MC histograms are stacked. |
Figure 4 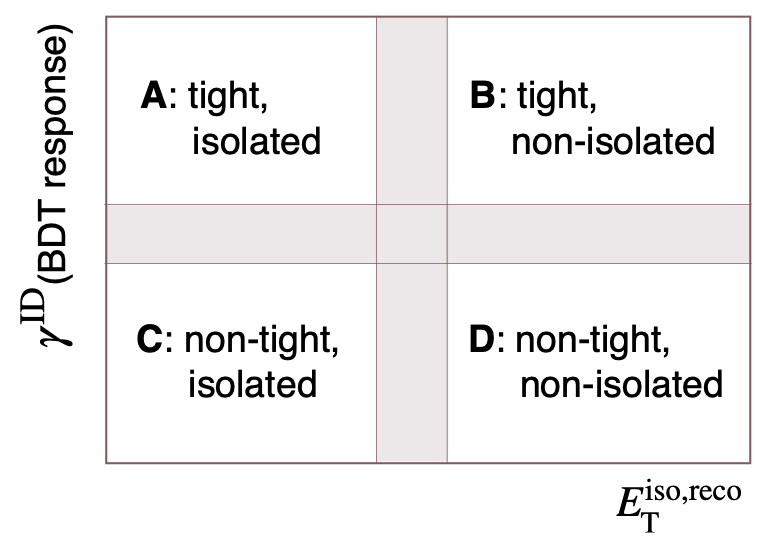
Diagram of the signal region (A) and sideband regions (B, C, D) used for purity estimation. The shaded bands indicate gaps between the signal and sideband regions. |
Figure 5 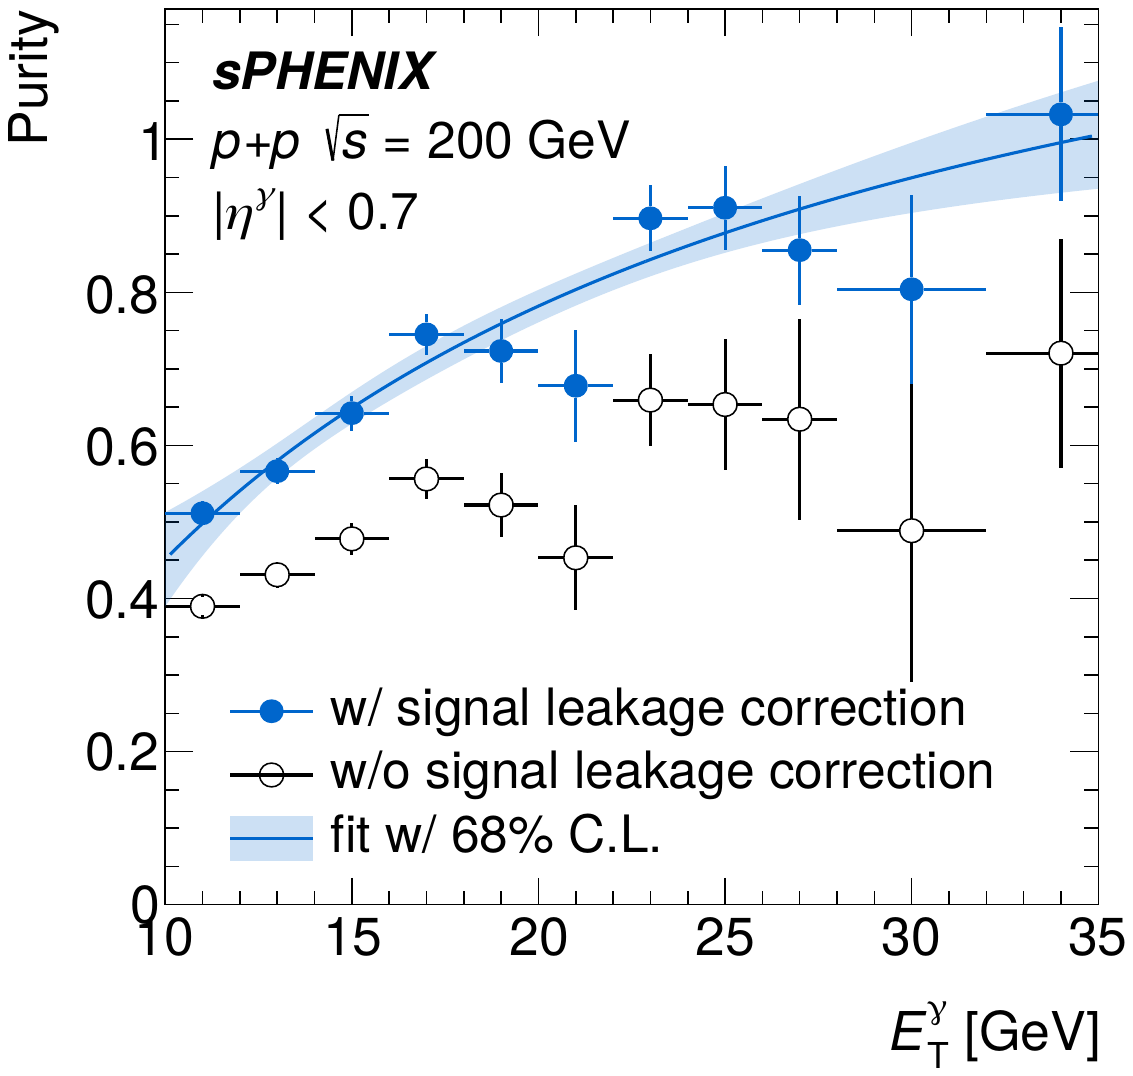
Purity as a function of ETγ with and without signal leakage correction. The purity with leakage correction is fitted with a Padé function, and the shaded area shows the 68% confidence interval of the fit. |
Figure 6 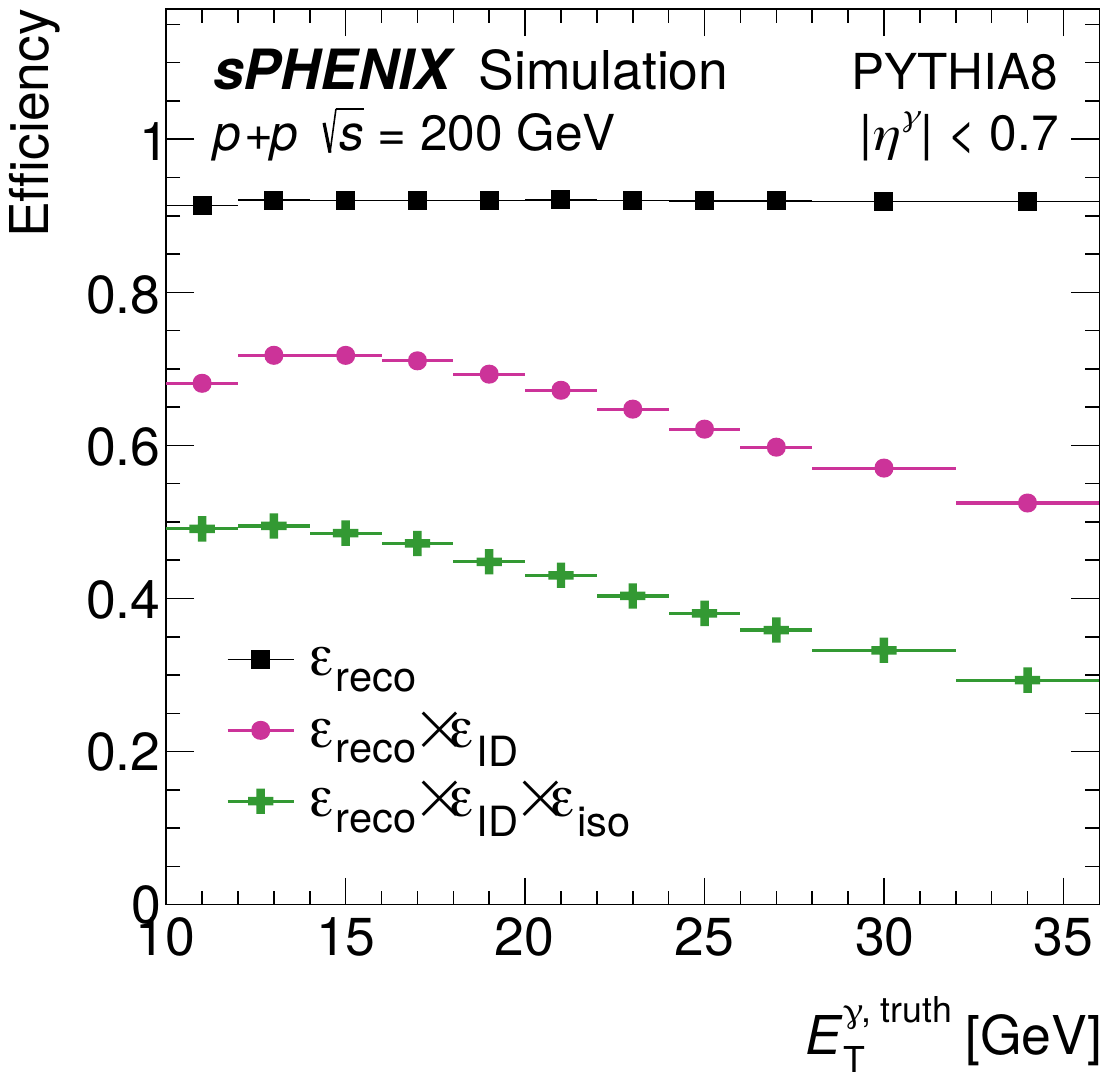
Reconstruction (εreco), identification (εID), isolation (εiso), and combined (εtot) efficiencies as a function of truth photon ETγ, truth. The statistical uncertainties on the efficiencies are smaller than the marker size. |
Figure 7 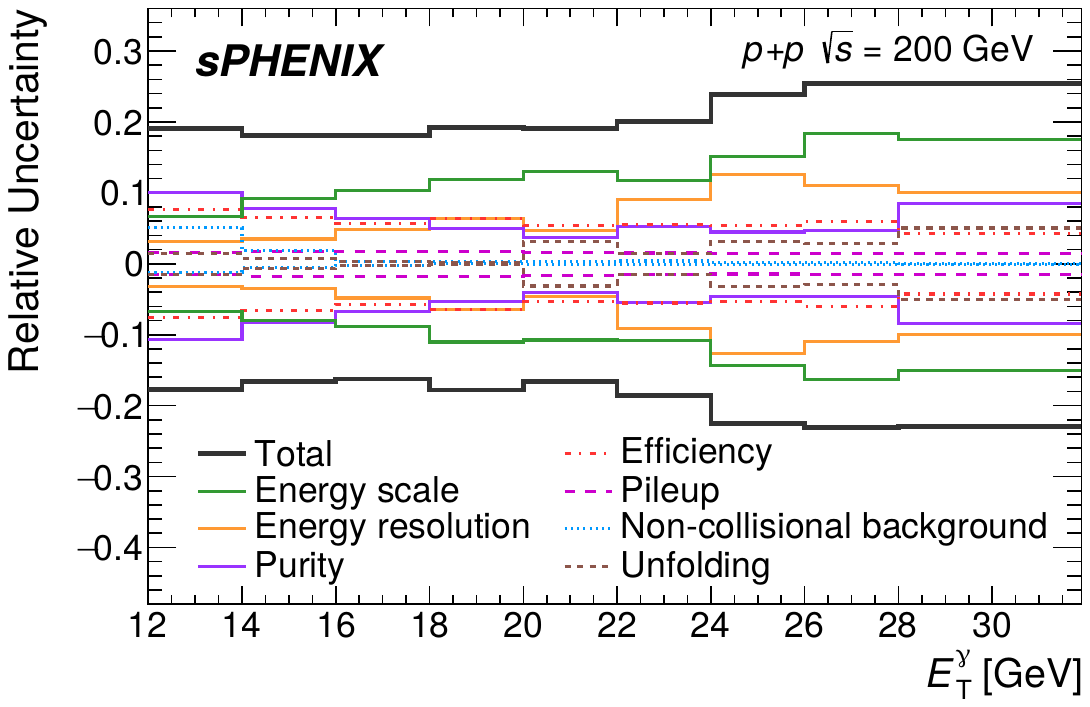
Breakdown of relative systematic uncertainties as a function of ETγ. The total envelope includes the global luminosity uncertainty (added in quadrature, ETγ-independent at +9.1%−6.8%) in addition to the seven components shown. |
Figure 8 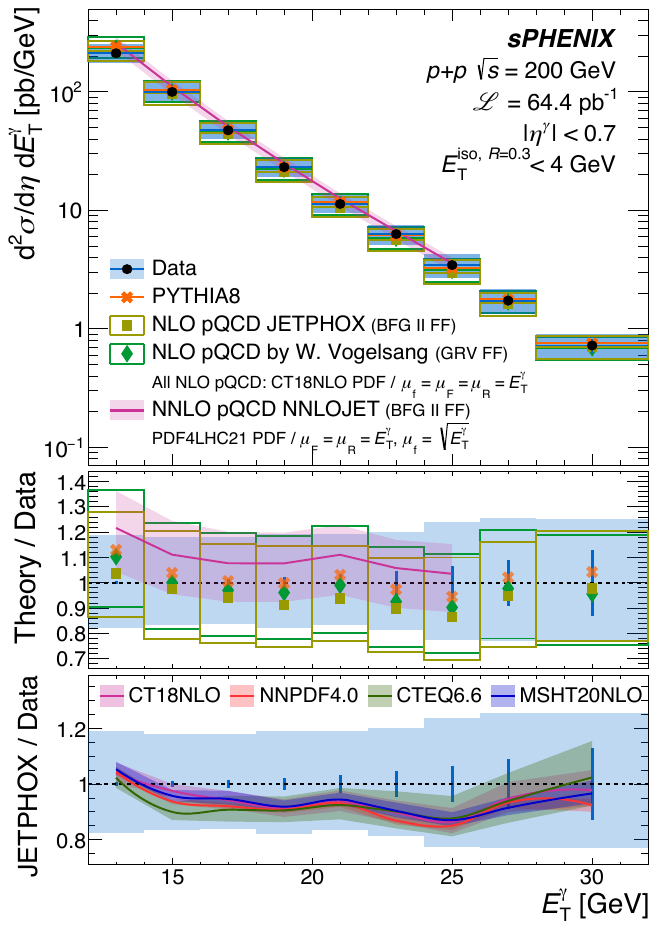
Differential cross section of isolated prompt photons as a function of ETγ in p+p collisions at √s = 200 GeV, in the kinematic range |ηγ| < 0.7 and 12 < ETγ < 32 GeV. The data are compared in the upper panel with predictions from PYTHIA 8.307 (Detroit tune), JETPHOX, the NLO pQCD calculation by Vogelsang, and the NNLO pQCD calculation from NNLOJET, all evaluated with the same truth-level isolation requirement as the data. For the data, statistical uncertainties are shown as vertical bars, and the total systematic uncertainty as shaded bands. The boxes around the NLO pQCD predictions and the shaded band around the NNLO pQCD prediction show the scale-variation uncertainties. The middle panel shows the theory-to-data ratio with the experimental statistical and systematic uncertainties drawn around unity as vertical bars and a shaded band, respectively. The lower panel represents the JETPHOX predictions with four different proton PDF sets with the PDF uncertainties shown as shaded bands around the lines (CT18NLO, NNPDF4.0, CTEQ6.6, and MSHT20NLO) divided by the data. |
Figure 9 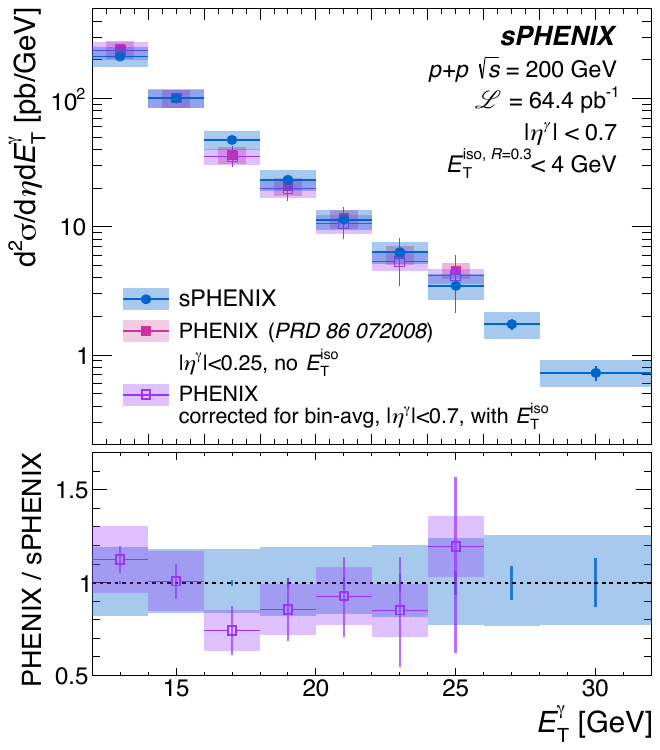
Comparison of the present isolated prompt photon cross section measurement (blue) with the PHENIX measurement (pink). The PHENIX measurement is corrected to match to the sPHENIX bin-width, pseudorapidity acceptance |ηγ| < 0.7, and isolated photon definition, and shown as purple open squares. Details of the correction procedure are described in the text. Statistical uncertainties are shown as vertical bars, and total systematic uncertainties are shown as shaded bands. The bottom panel shows the ratio of the corrected PHENIX data to the sPHENIX measurement, with the vertical bar at each ratio point representing the statistical uncertainty of the PHENIX measurement. The sPHENIX statistical (vertical bars) and total systematic (shaded band) uncertainties are drawn around unity across the full sPHENIX ETγ range. |
Figure 10 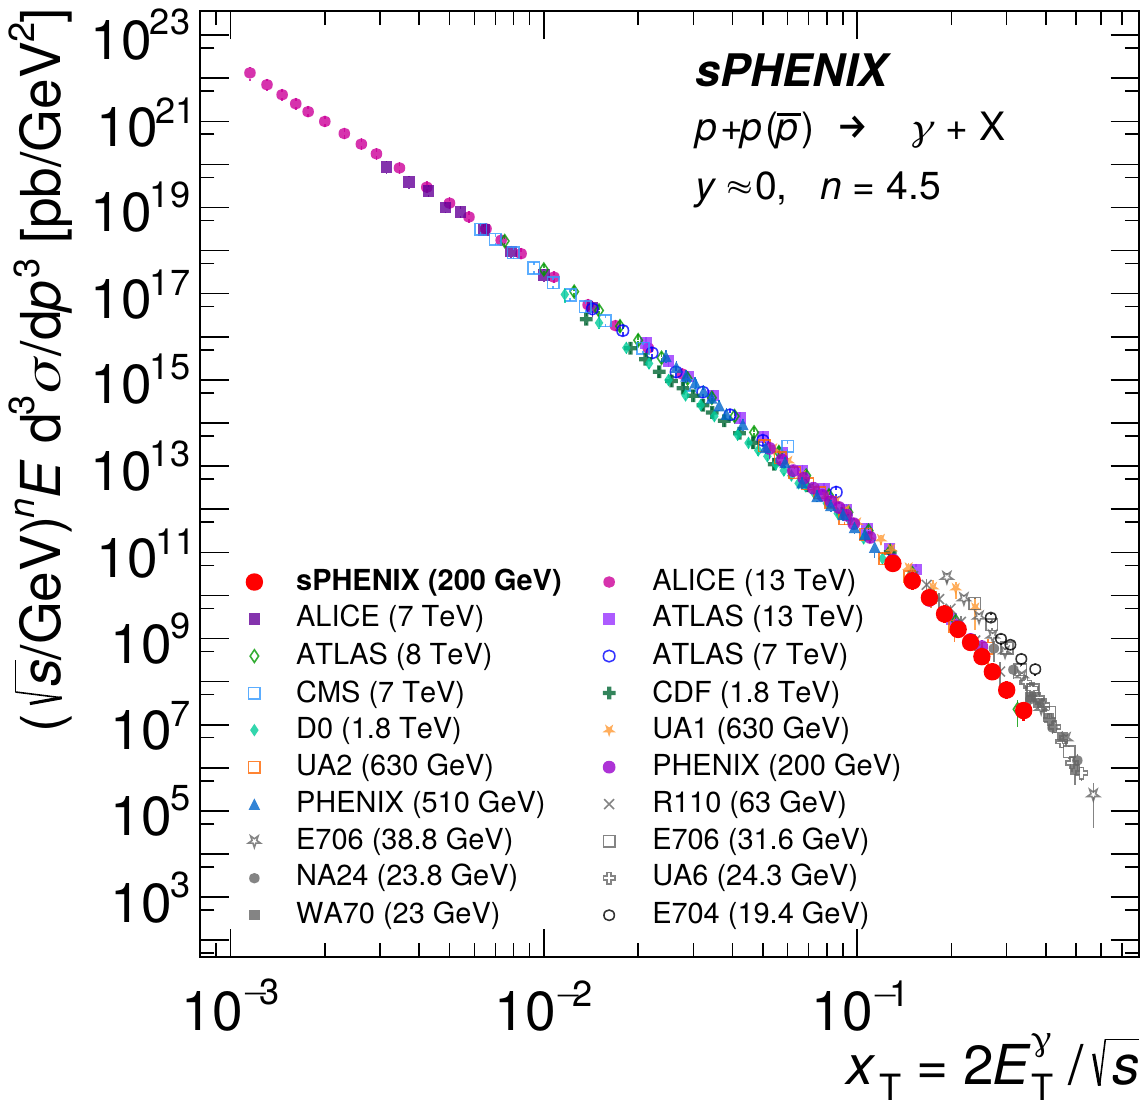
xT scaling of the invariant cross section for prompt photon production in p+p and p+p collisions from various measurements at different collision energies. The vertical axis is (√s/GeV)n E d3σ/dp3 with n = 4.5; the horizontal axis is xT = 2ETγ/√s. The sPHENIX measurement of this paper (red full circle) is overlaid on prompt photon measurements at the LHC, Tevatron, SppS, RHIC, ISR, and fixed-target experiments. |
Figure 11 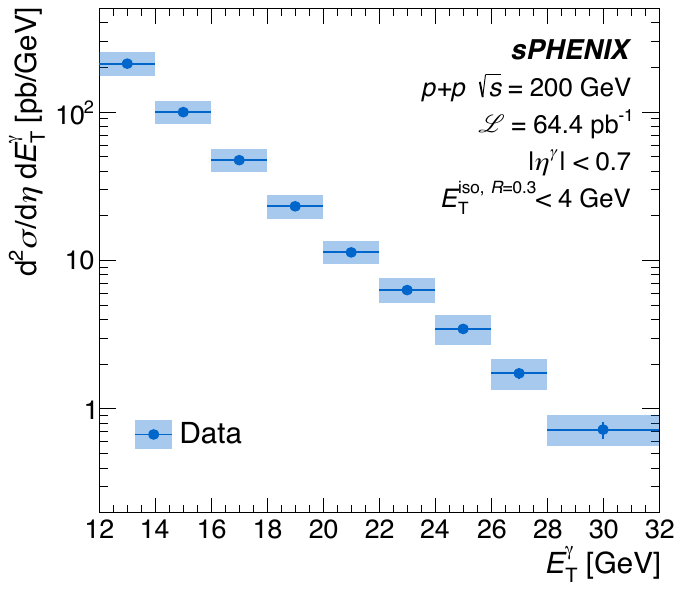
Differential cross section of isolated prompt photons as a function of ETγ in p+p collisions at √s = 200 GeV, in the kinematic range |ηγ| < 0.7 and 12 < ETγ < 32 GeV. The statistical uncertainties are shown as vertical bars, and the total systematic uncertainty as shaded bands. |