Date: 31 May 2024
Tag: sPH-CONF-BULK-2024-01
Document: Conference Note
(Back to sPHENIX Public Results page.)
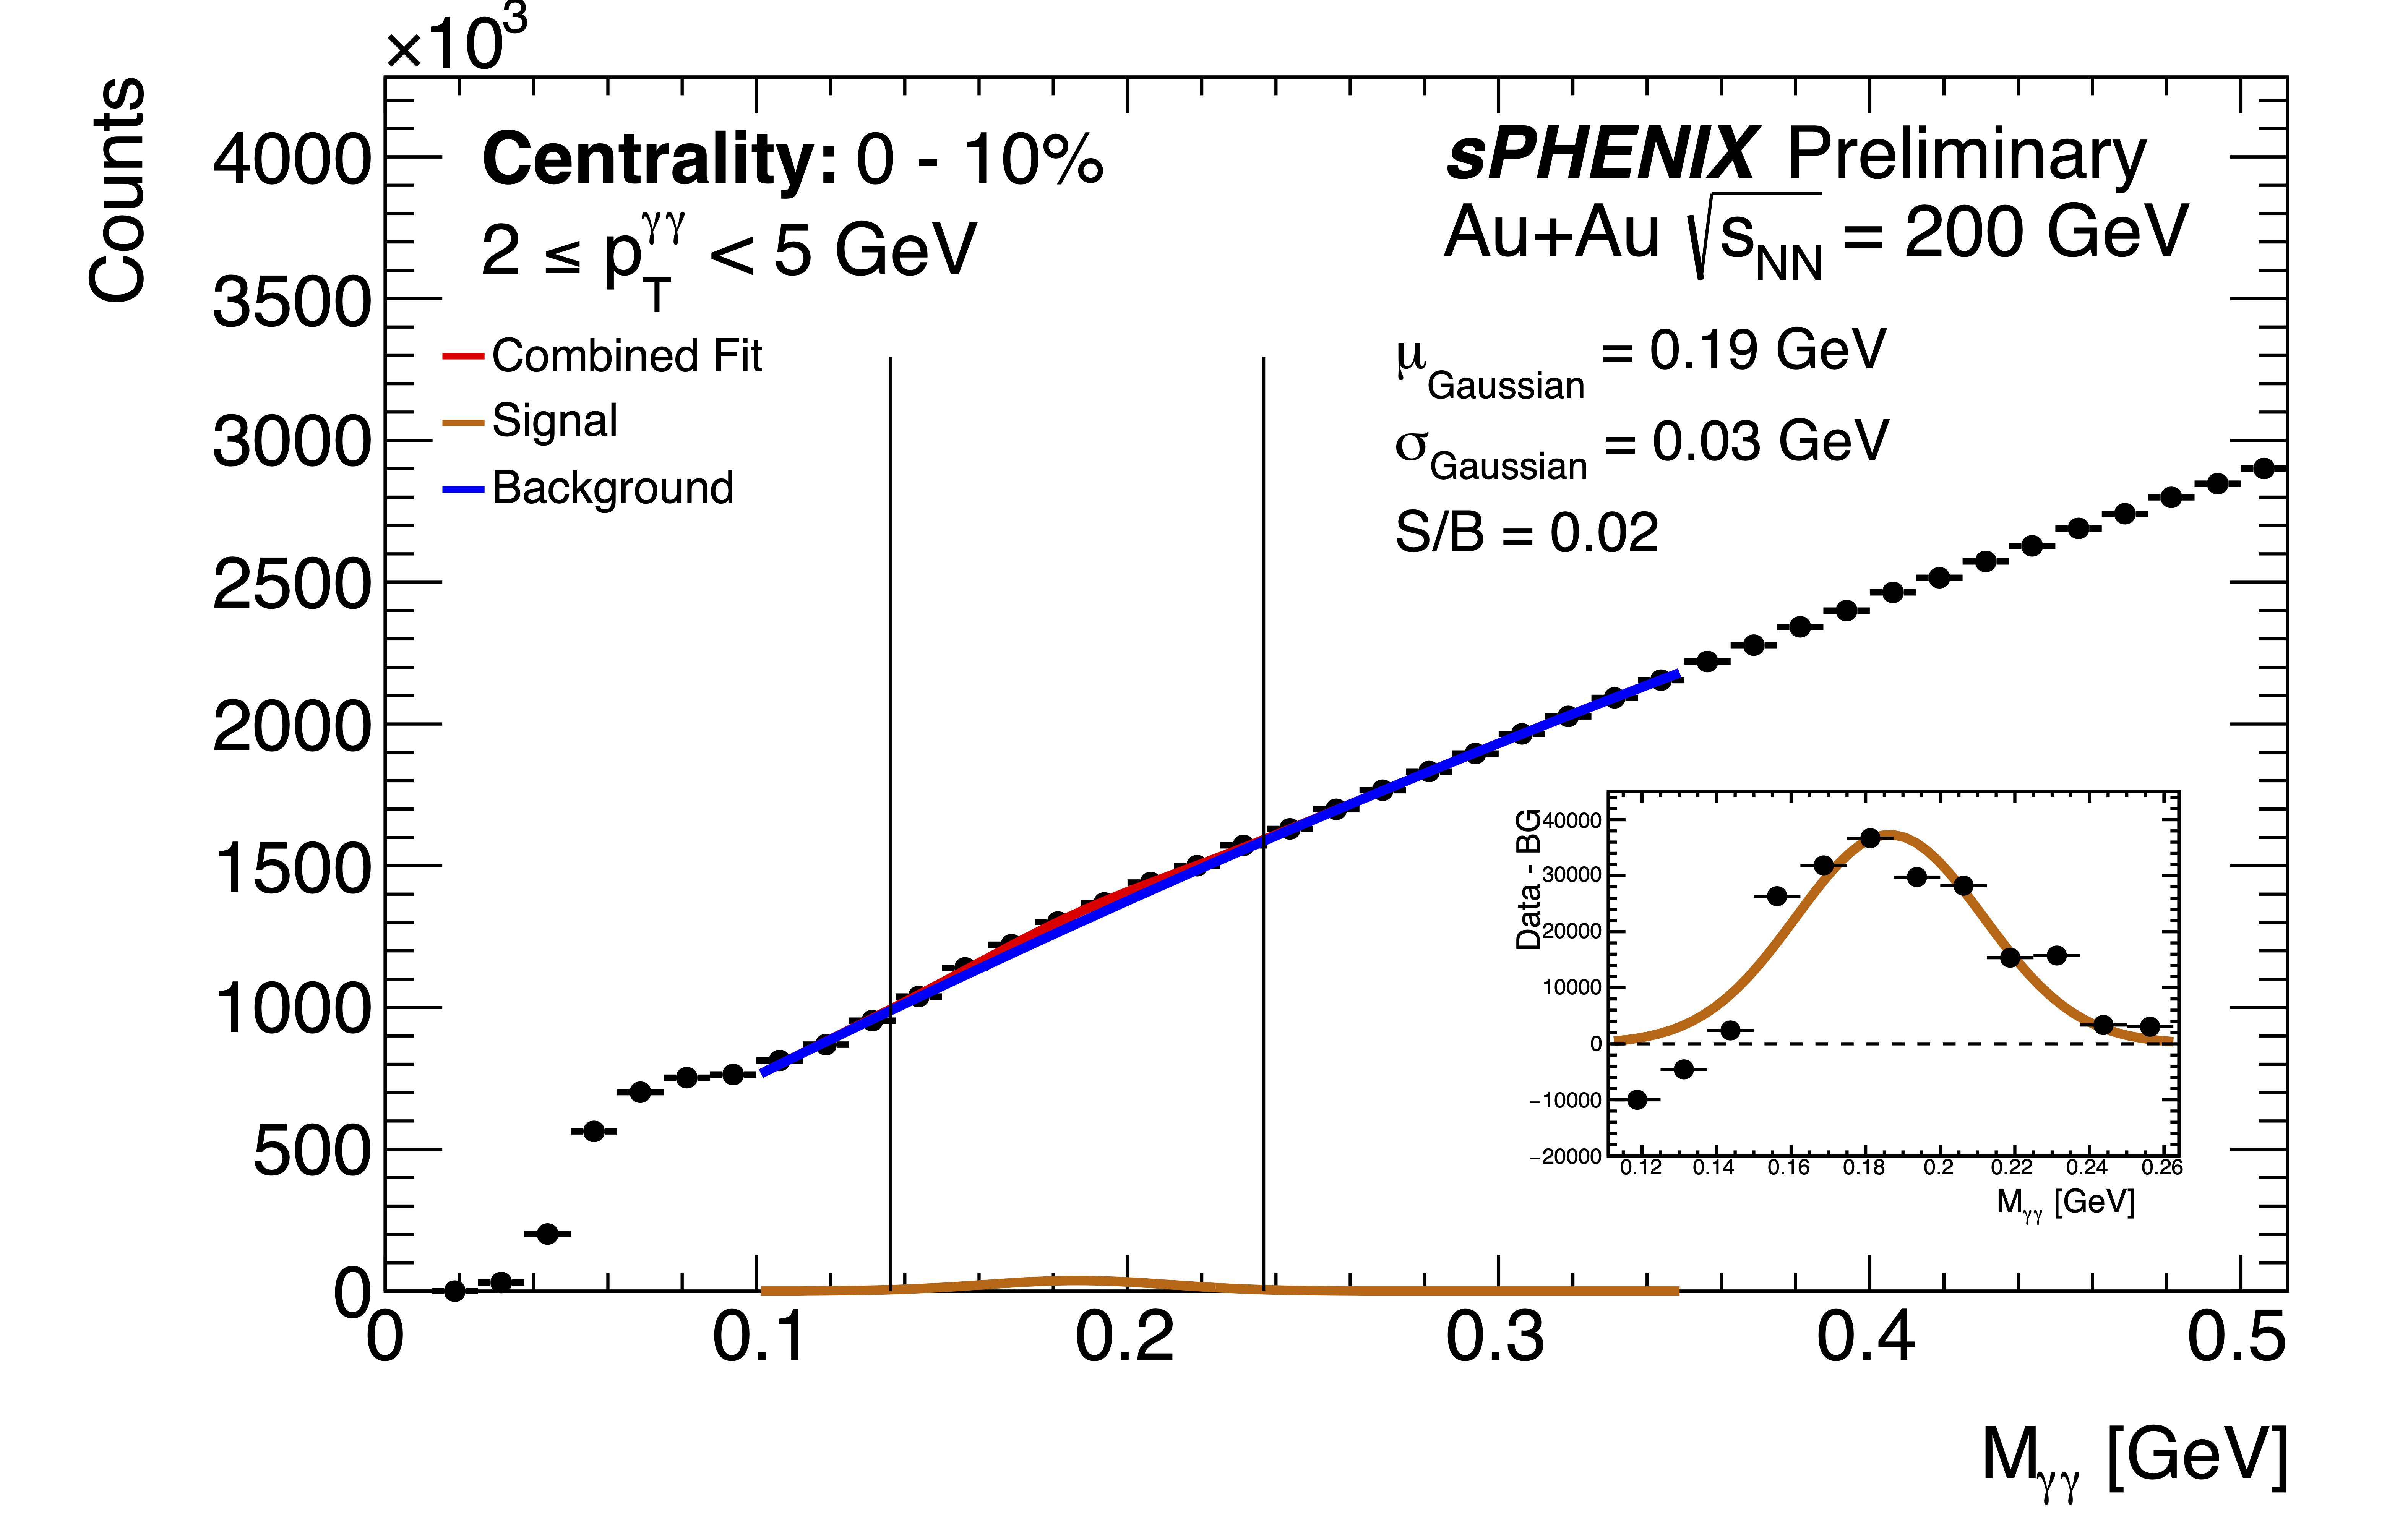
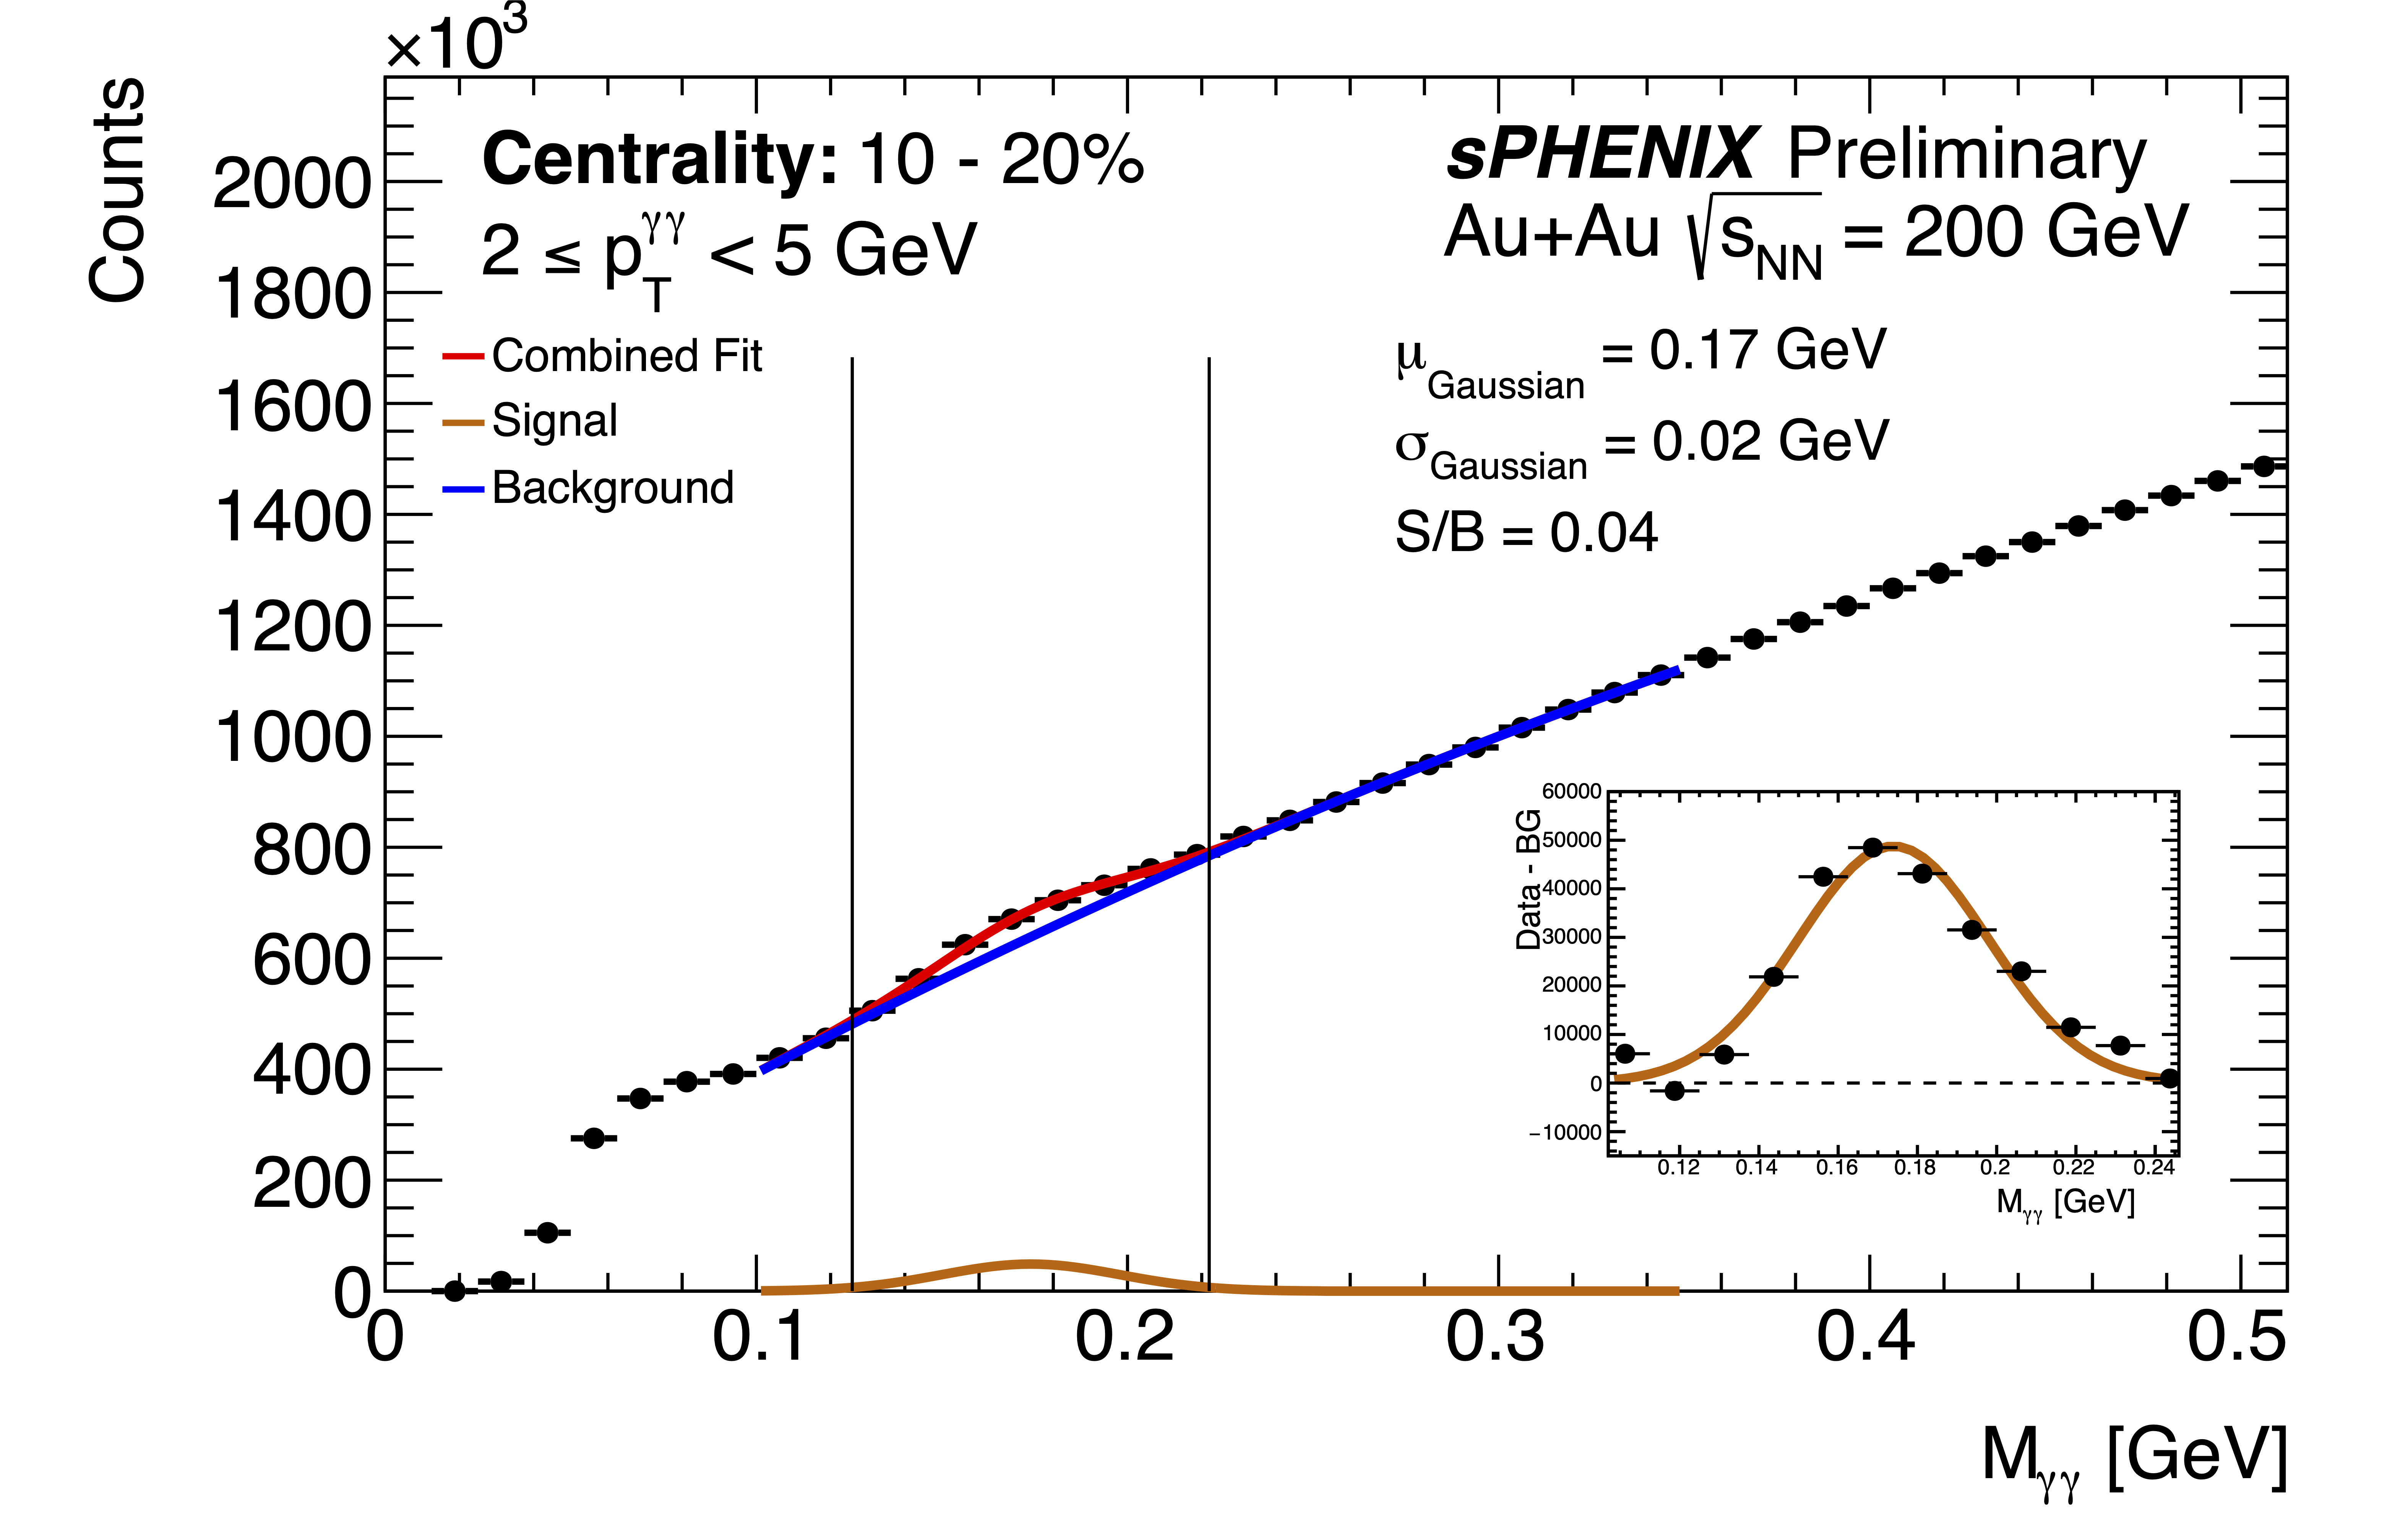
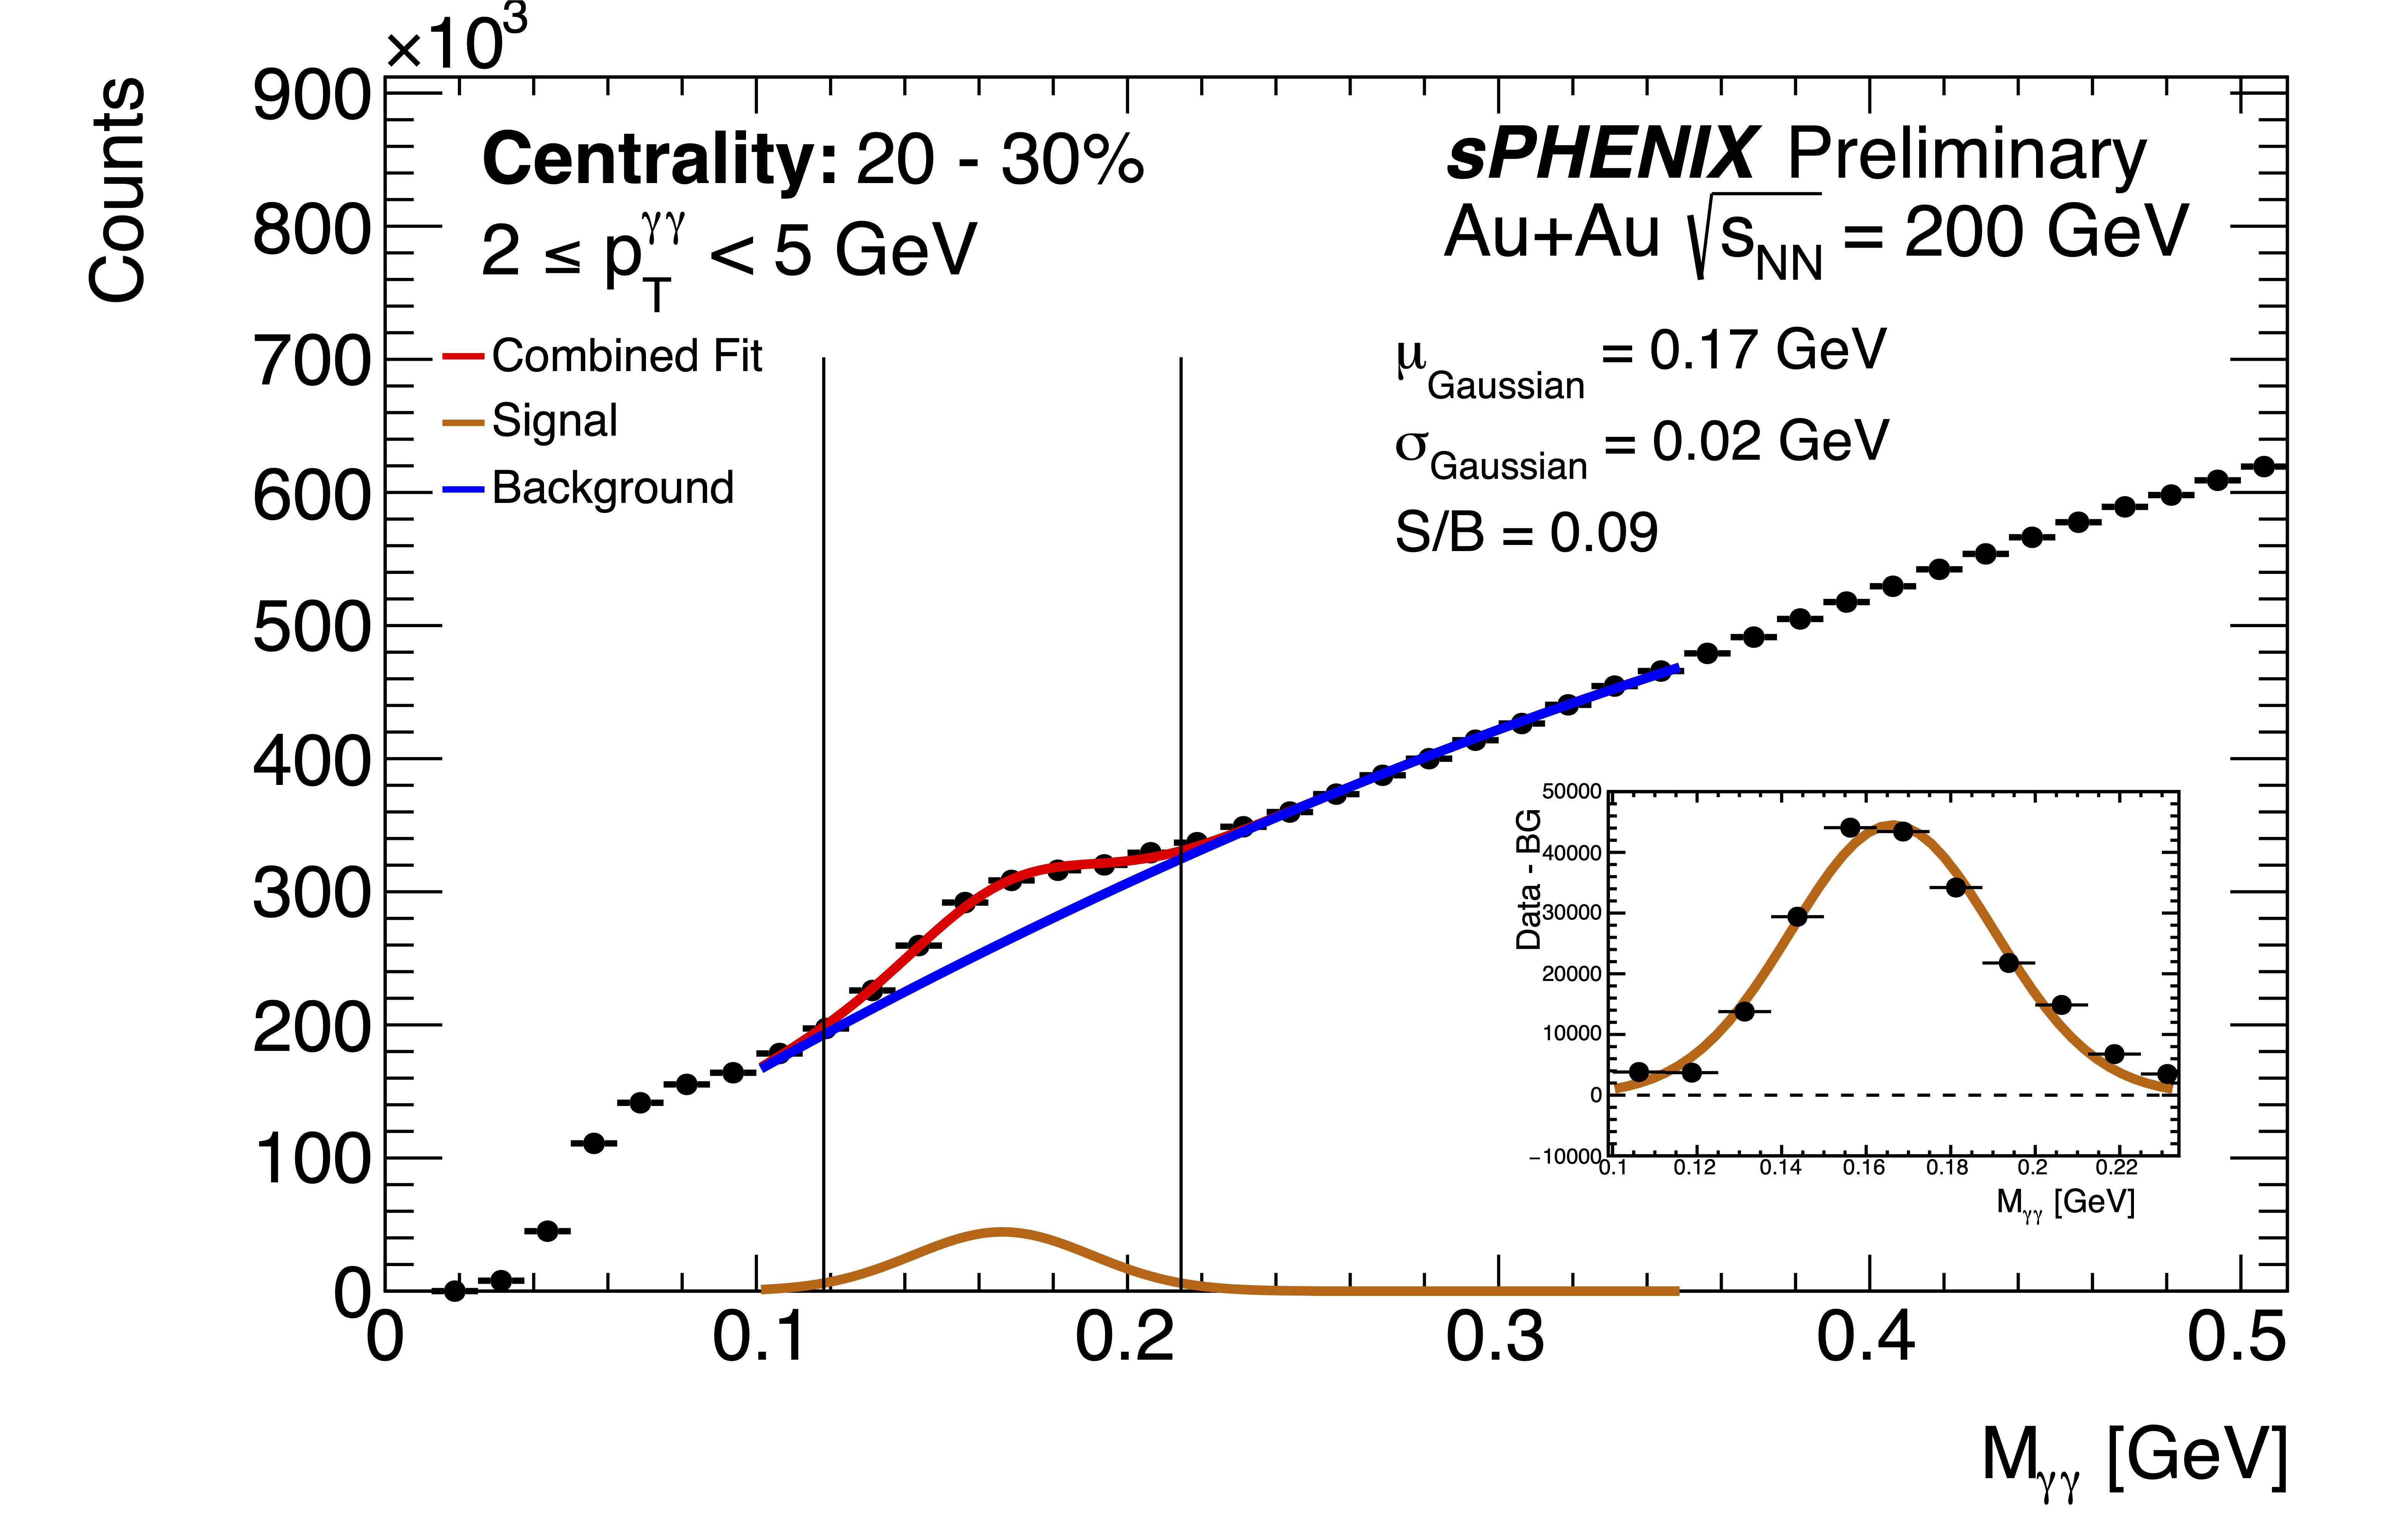
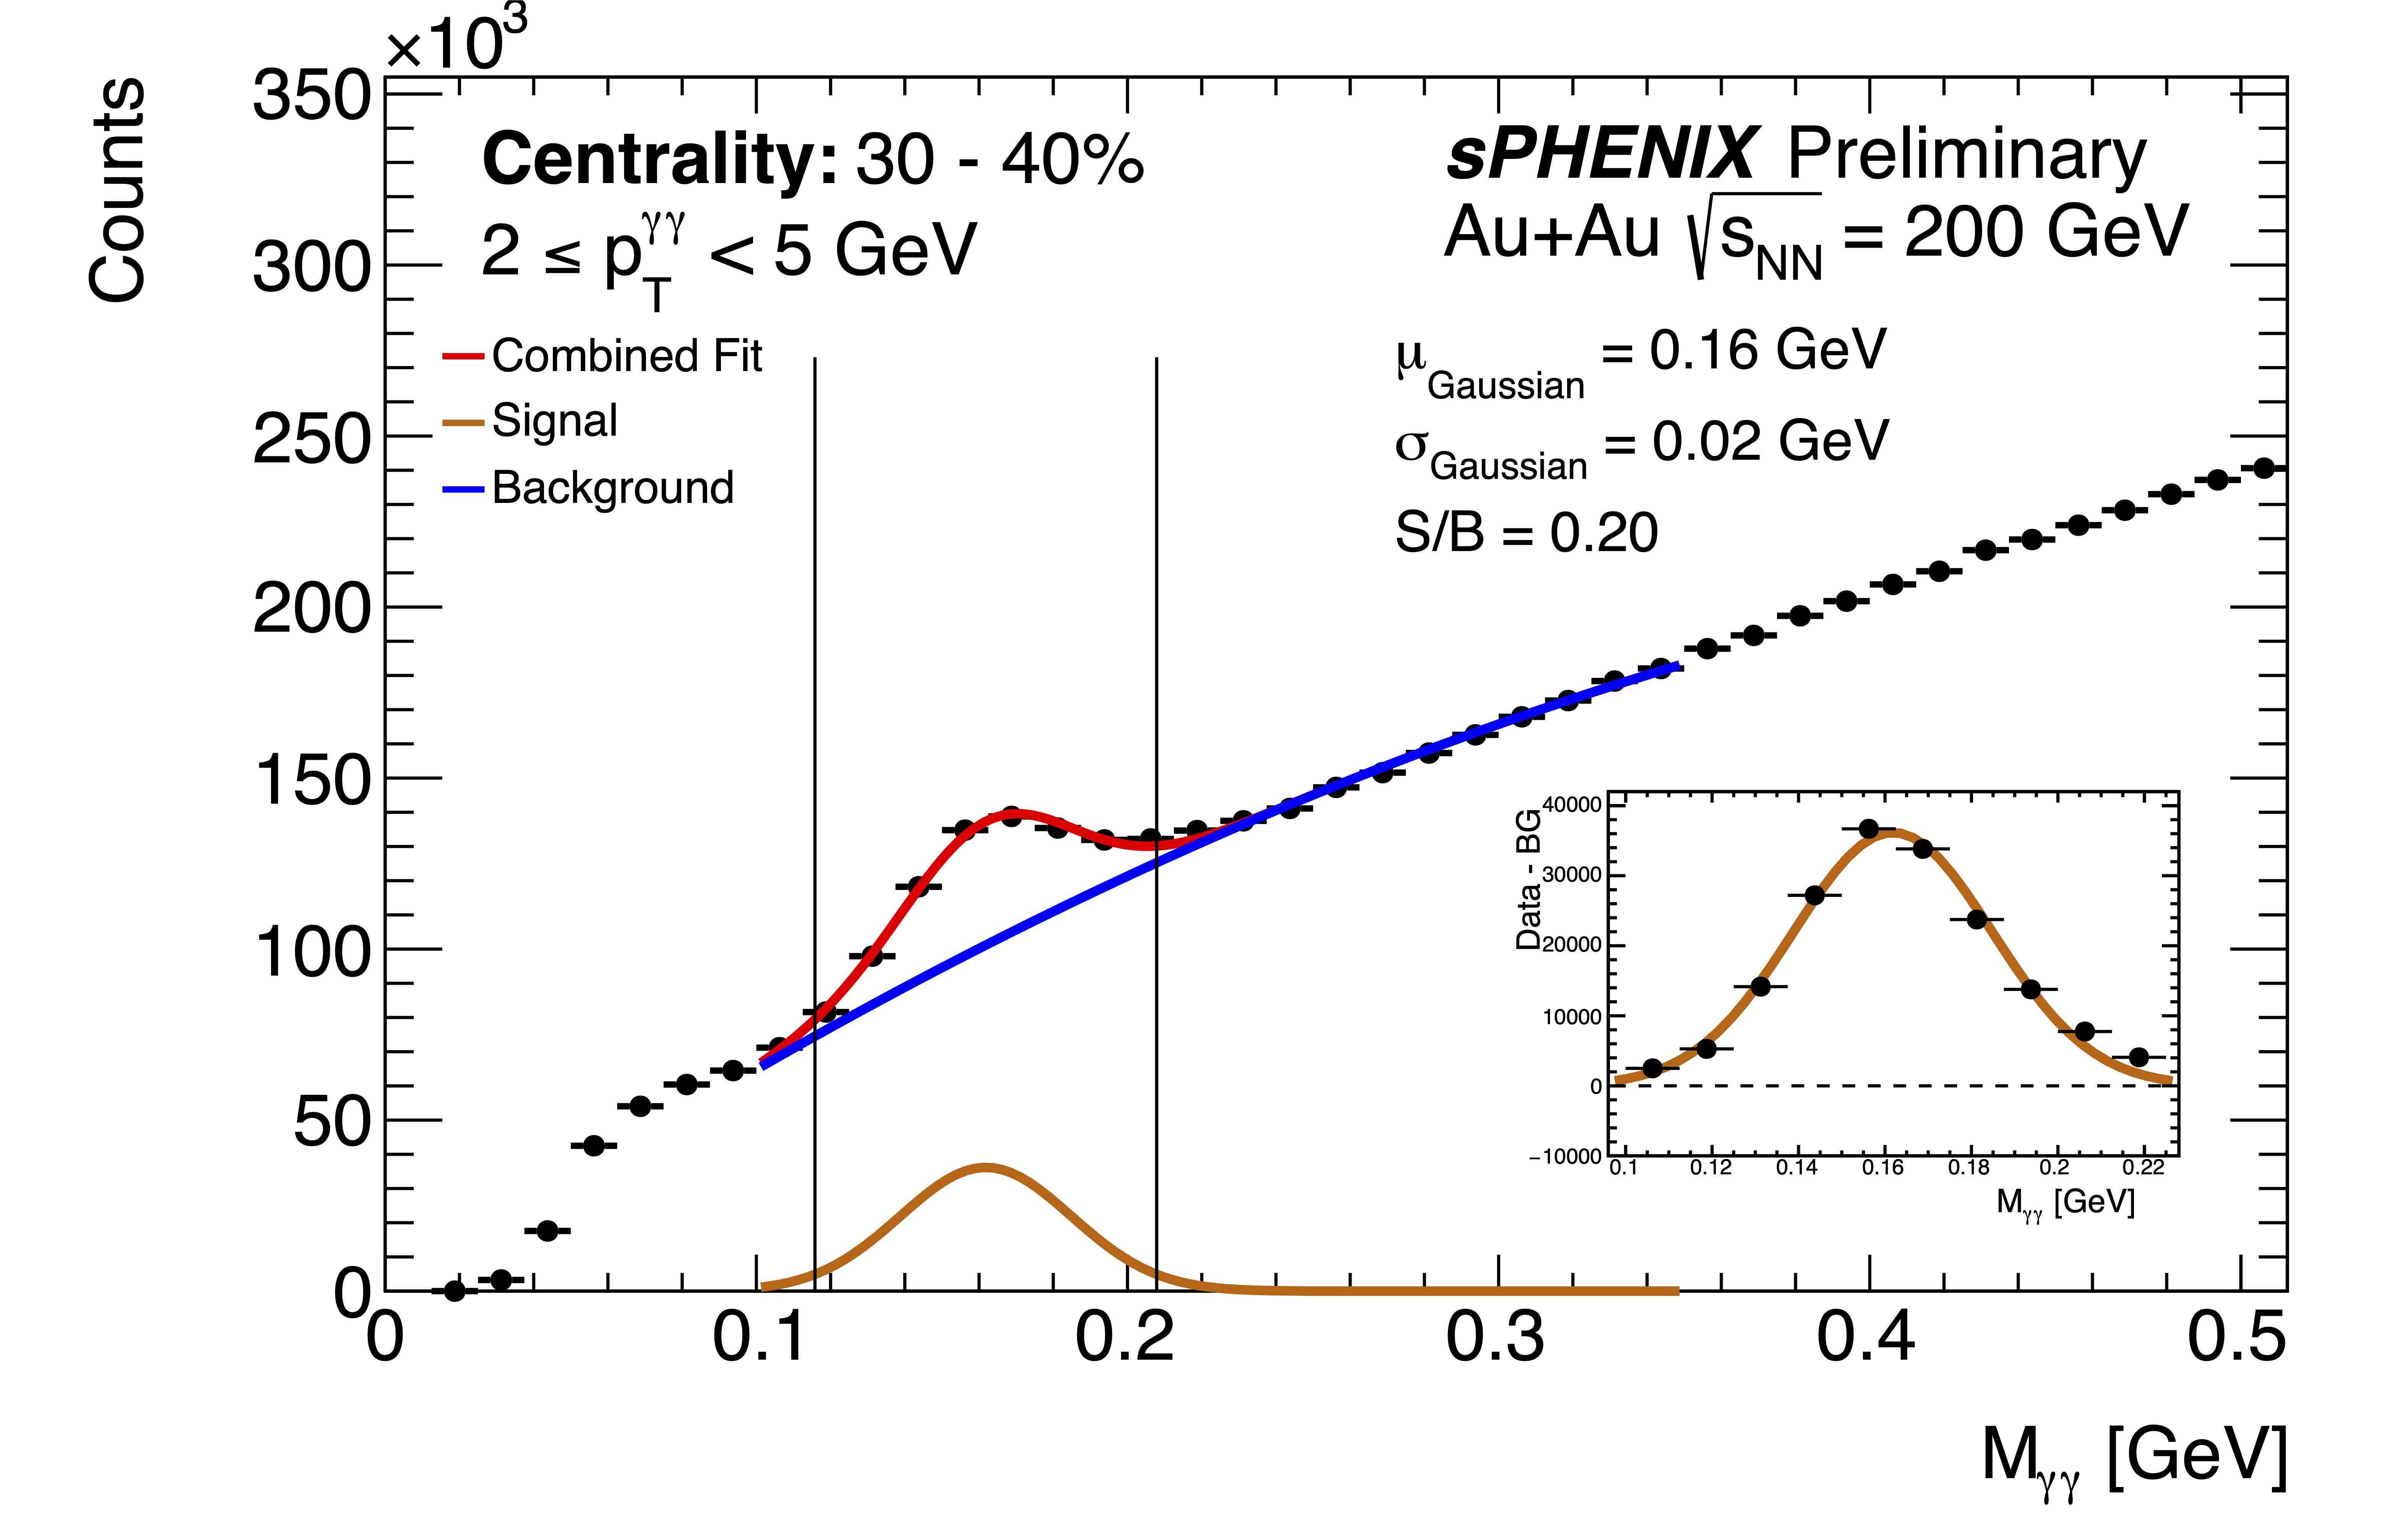
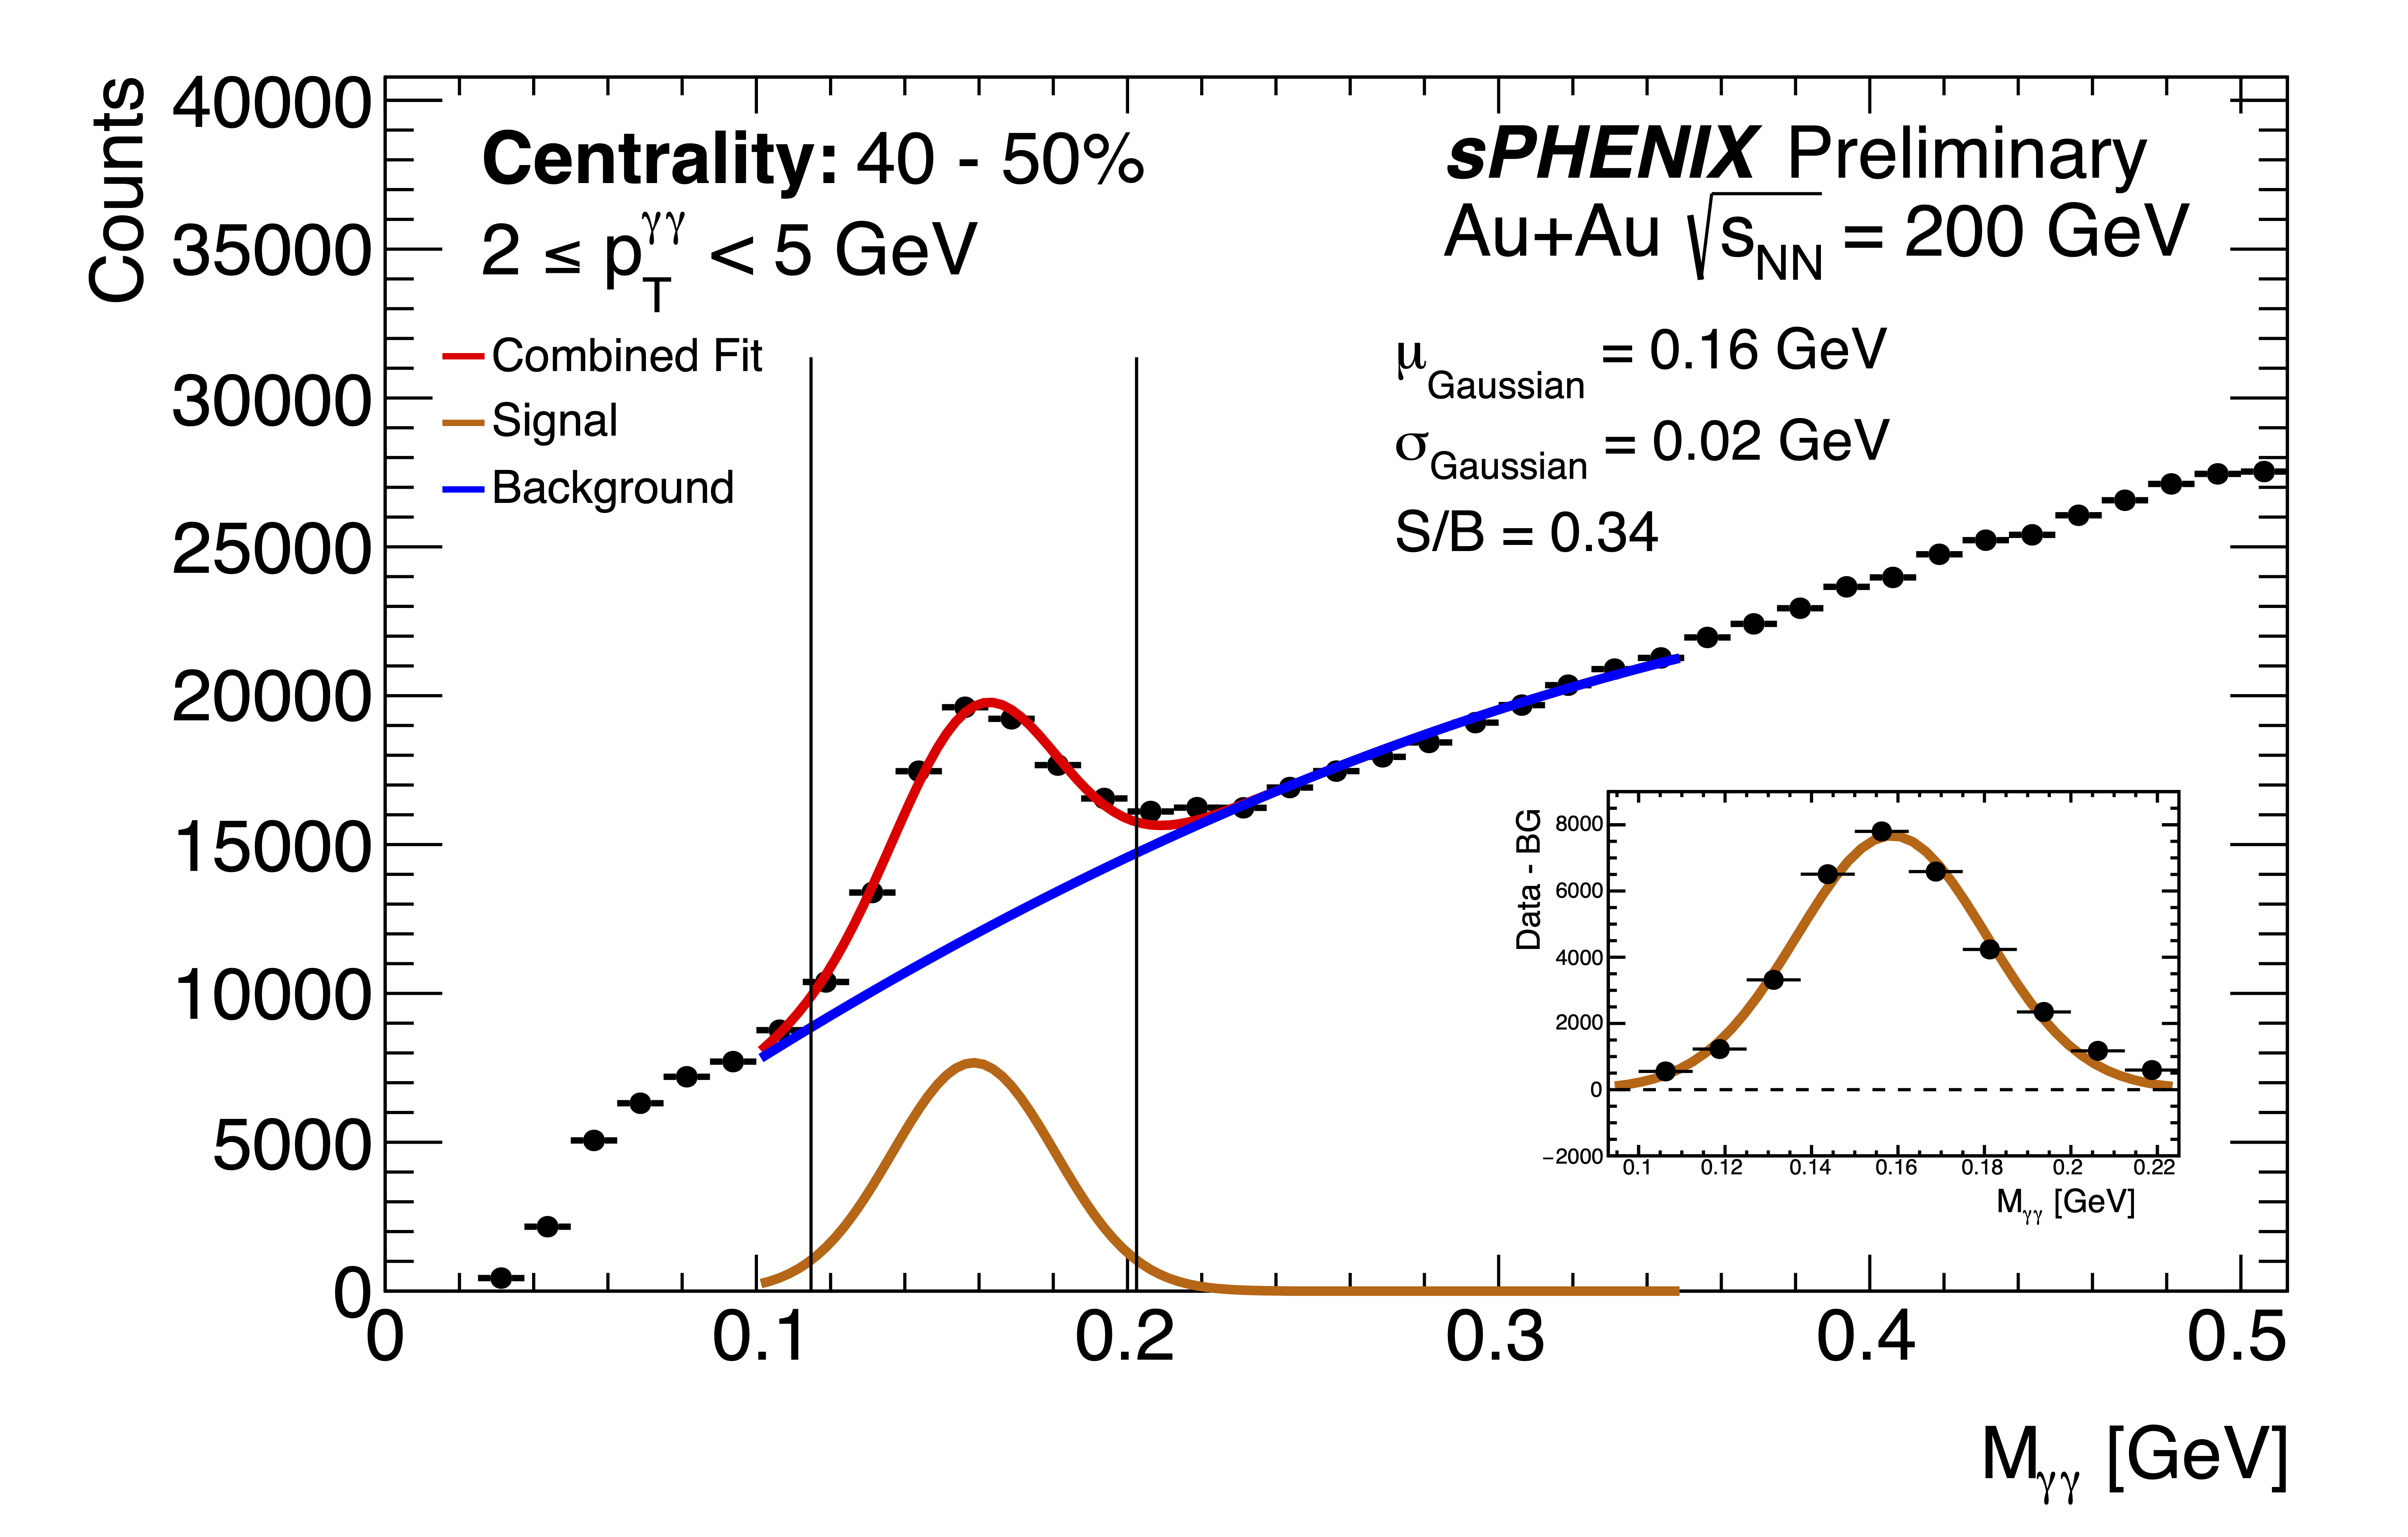
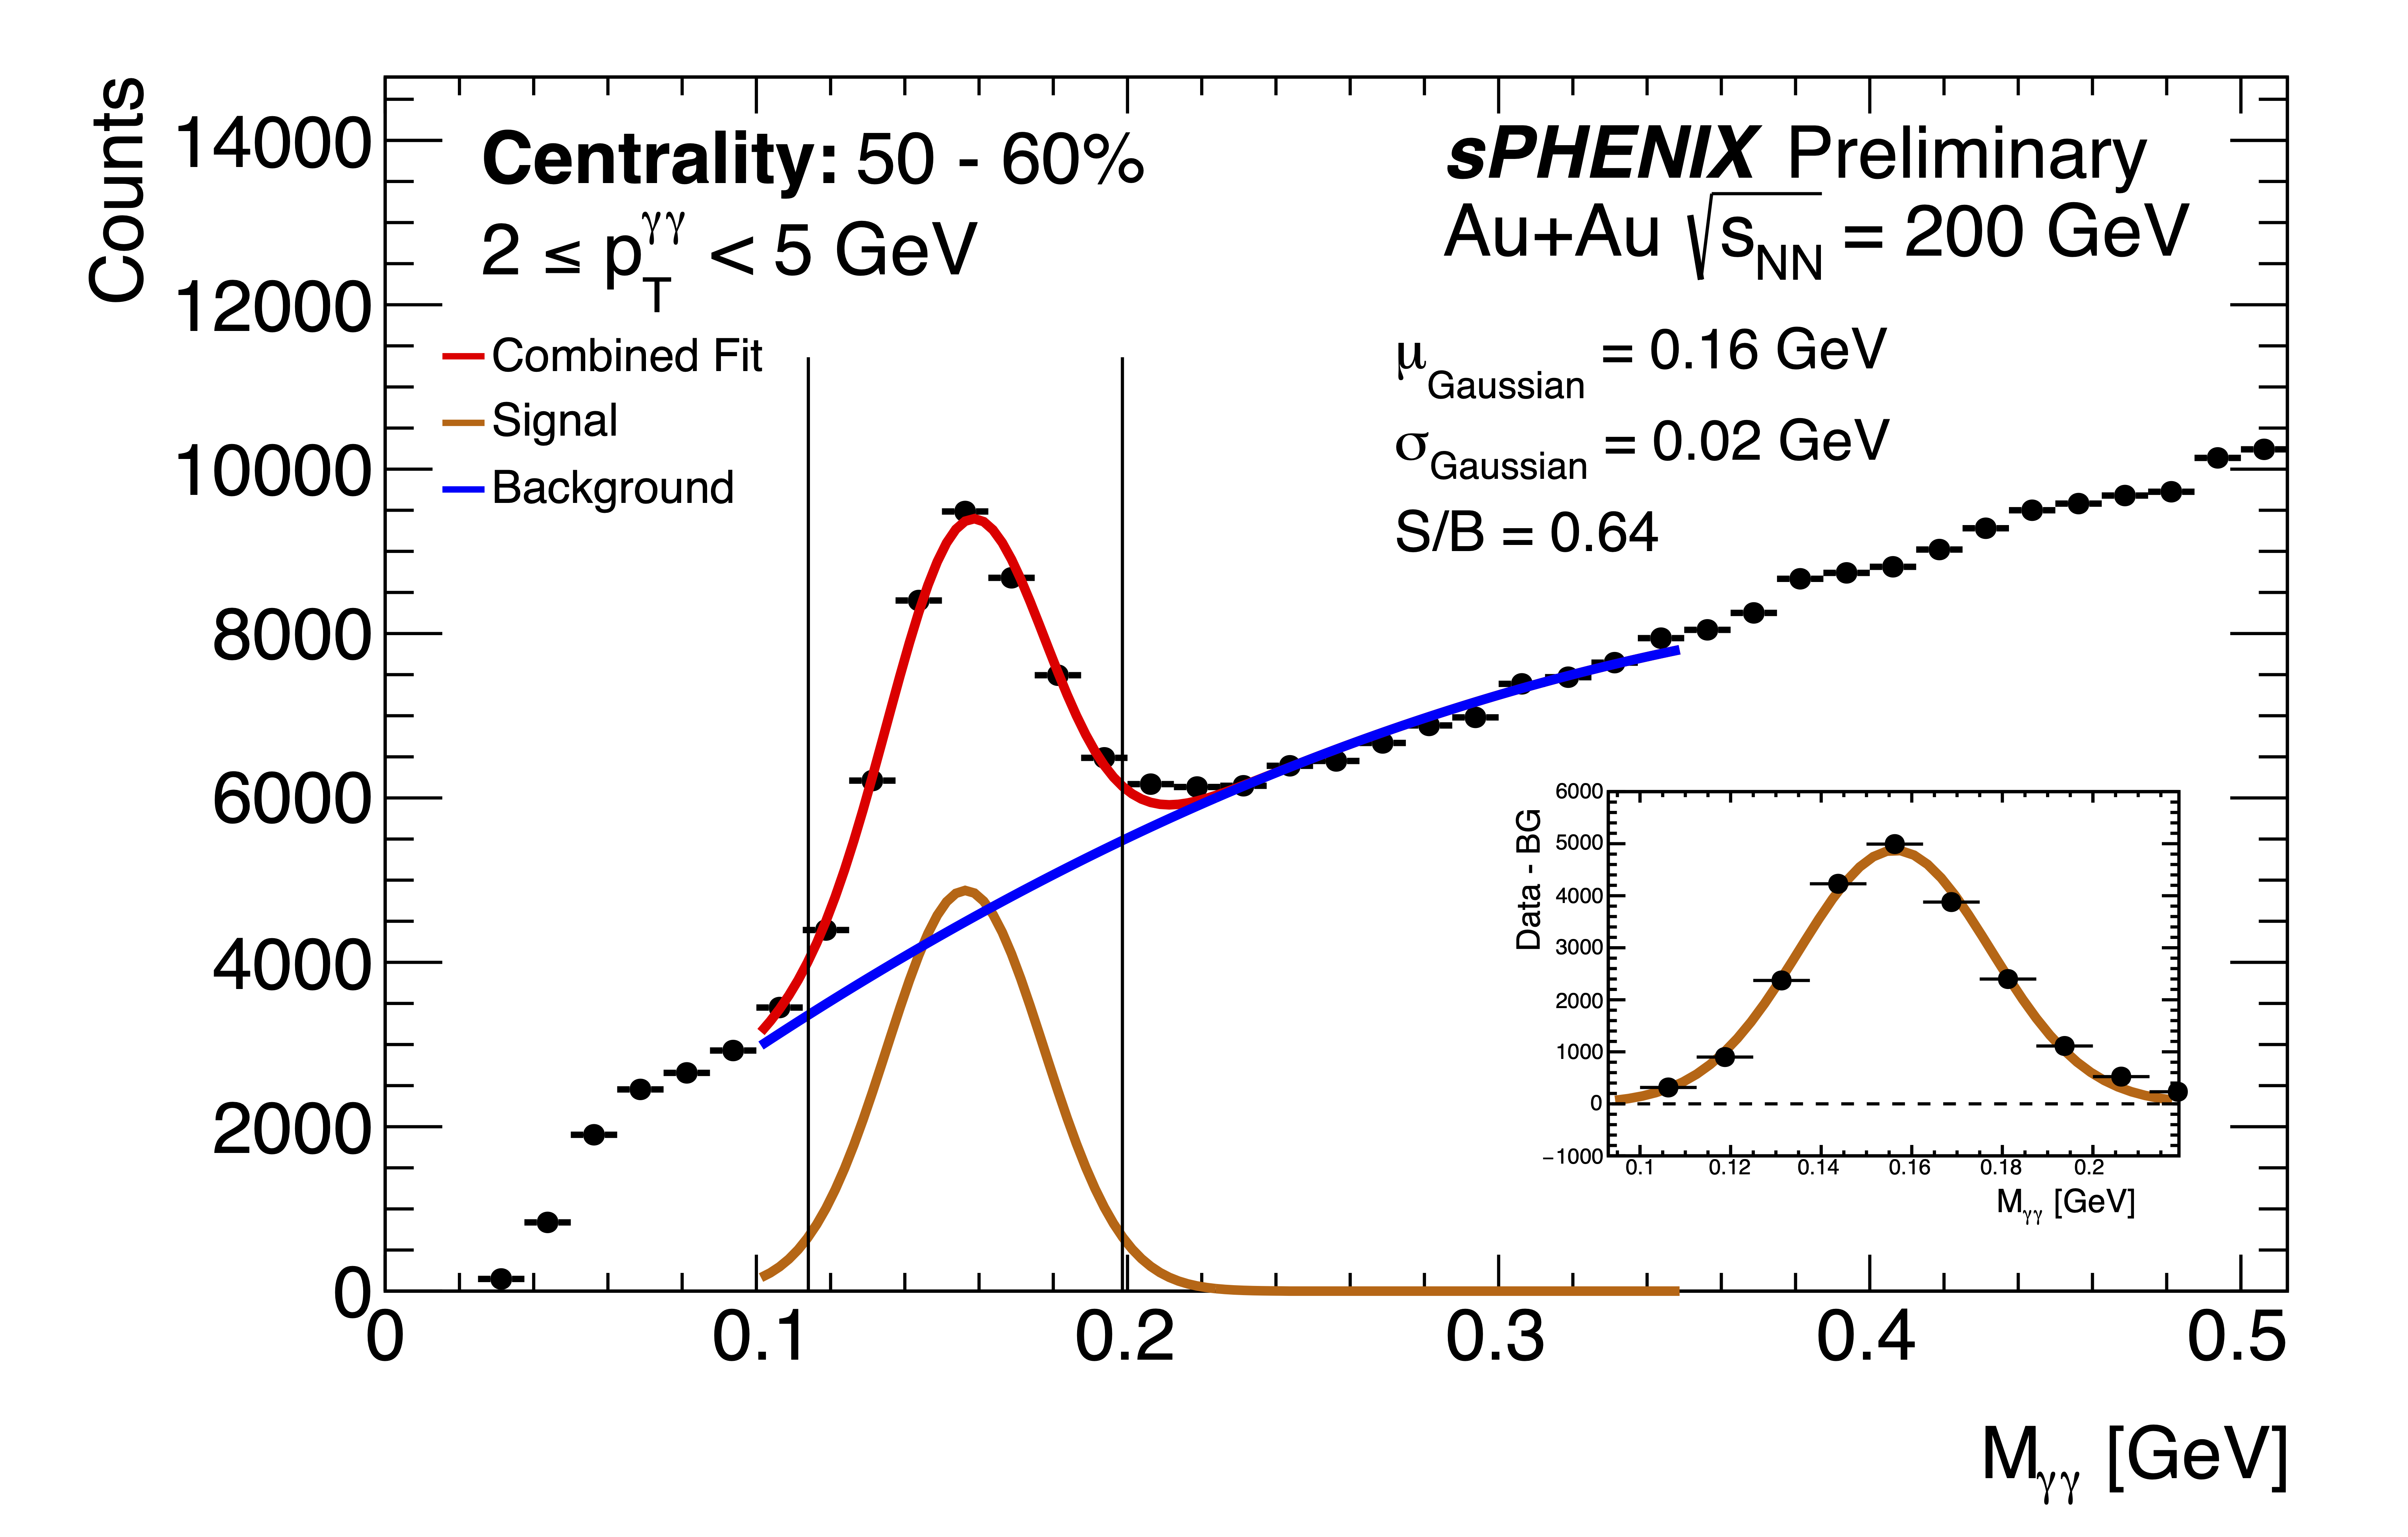
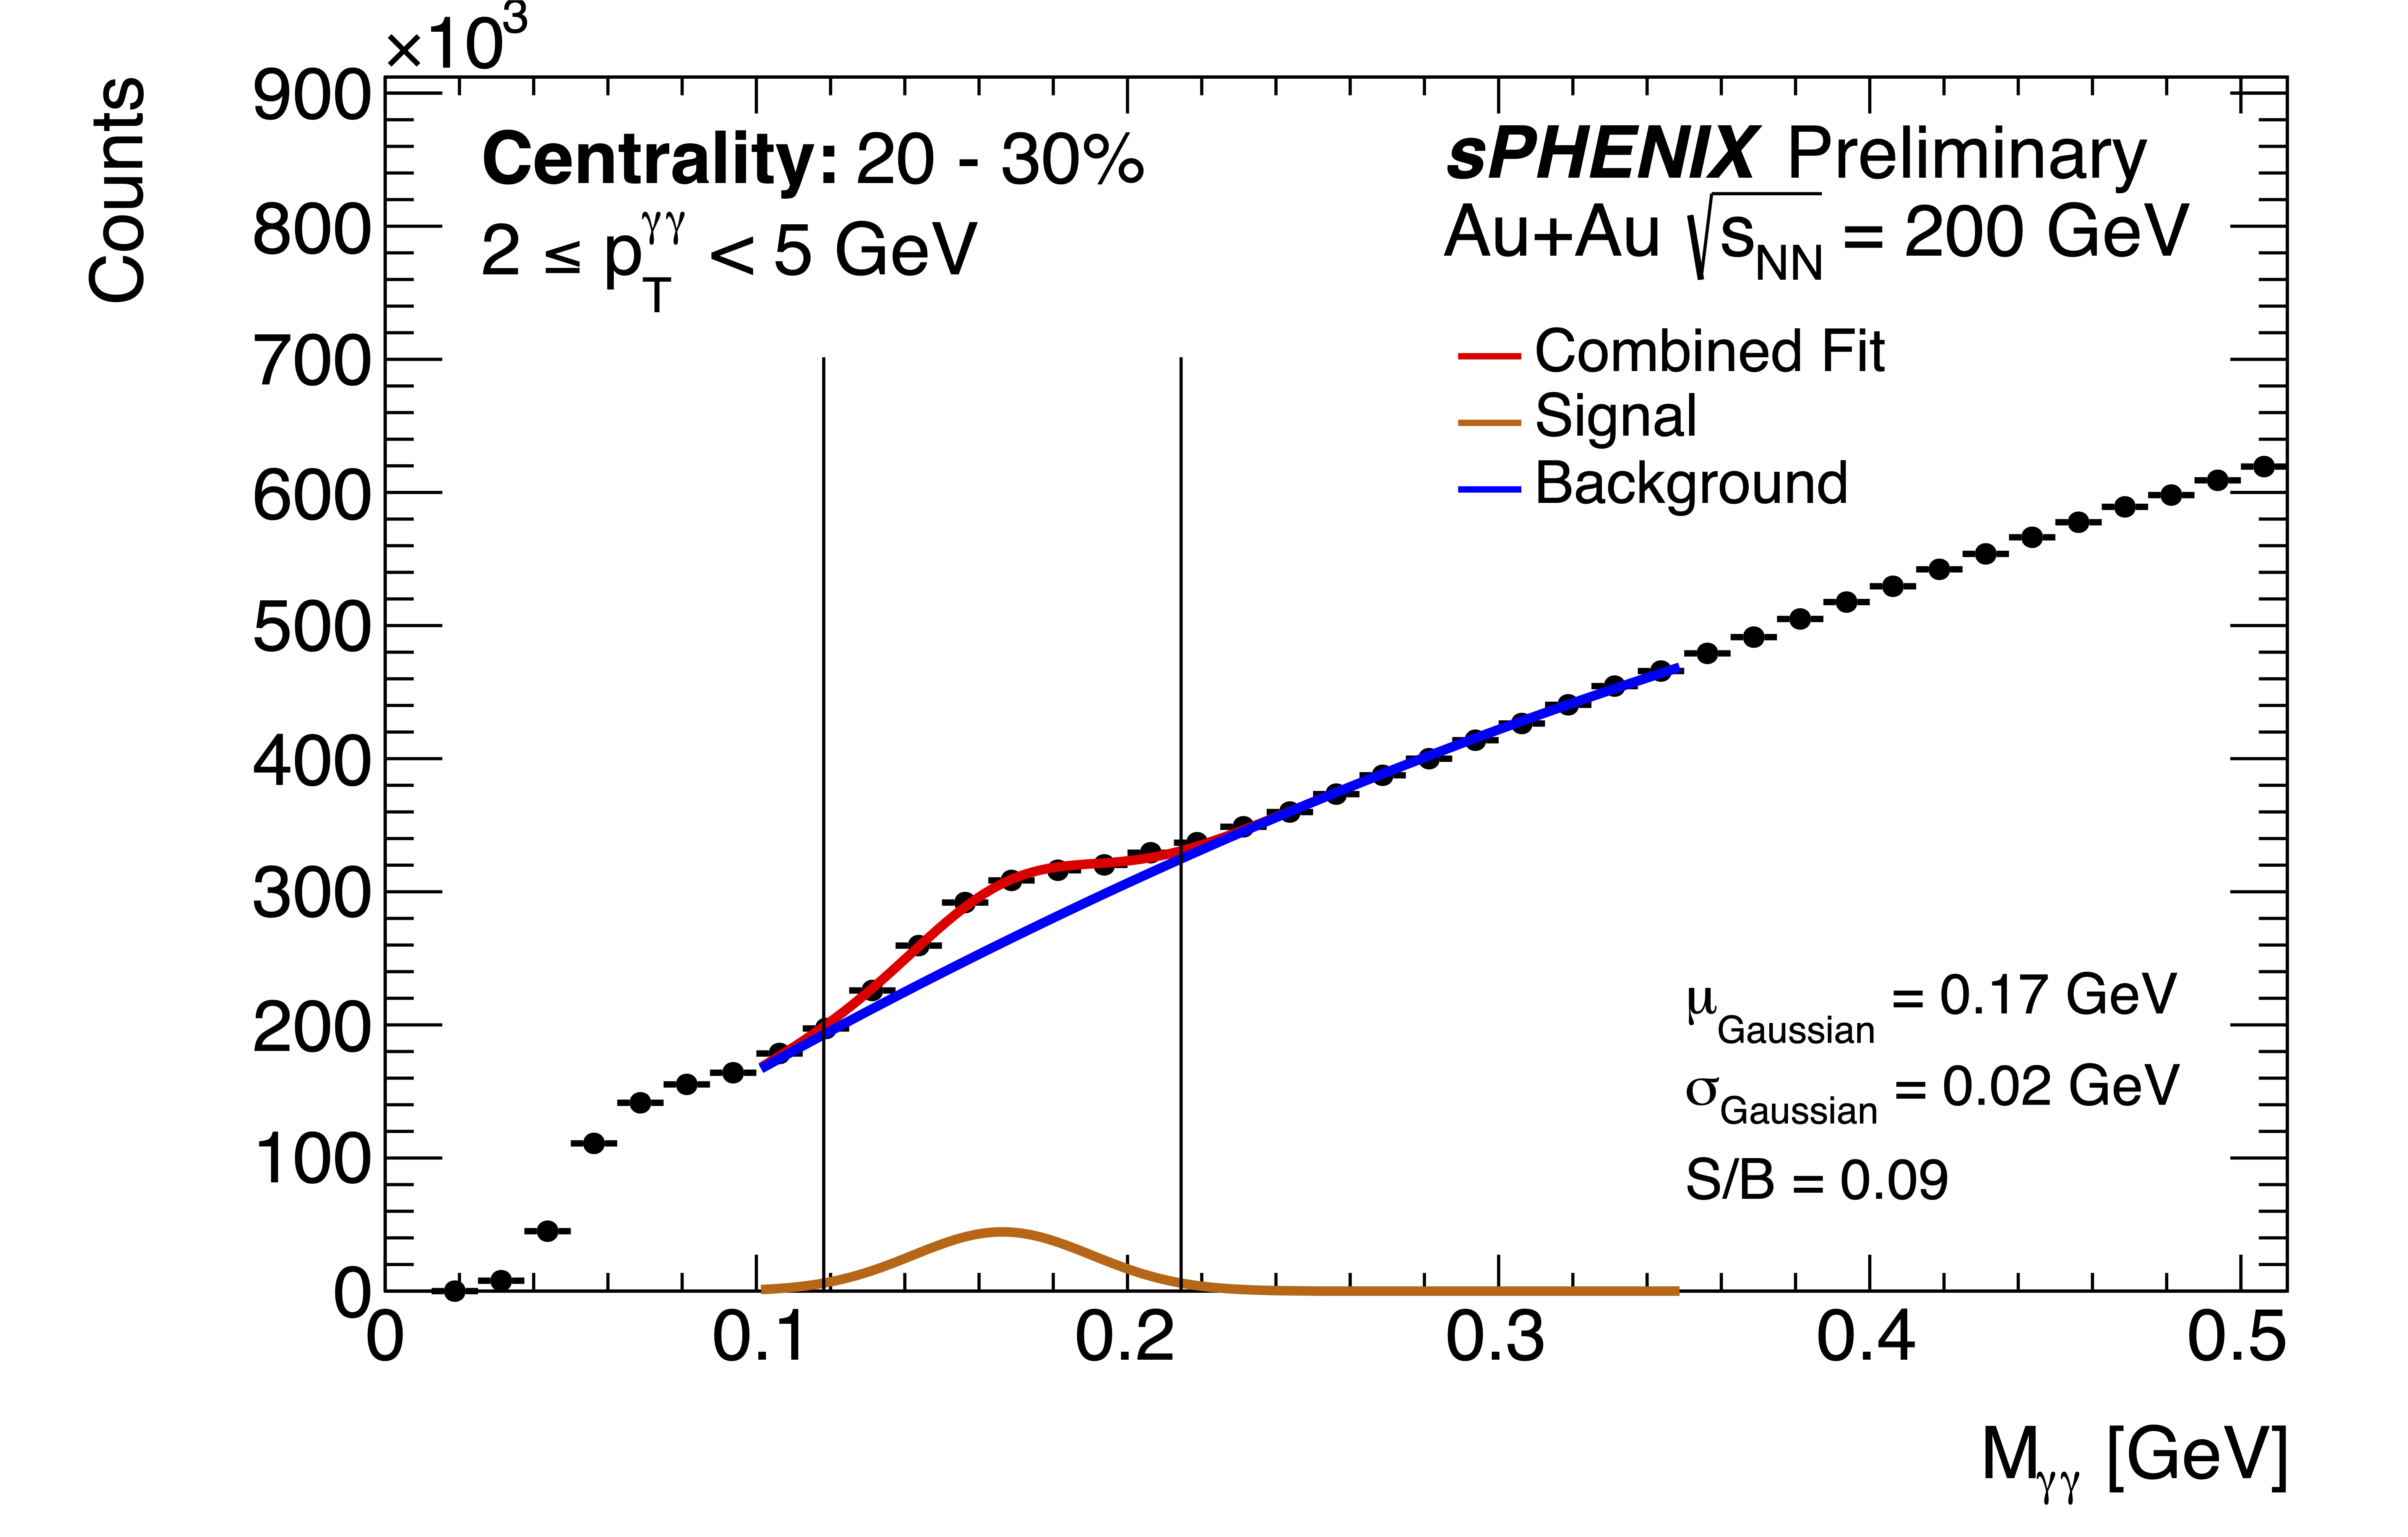
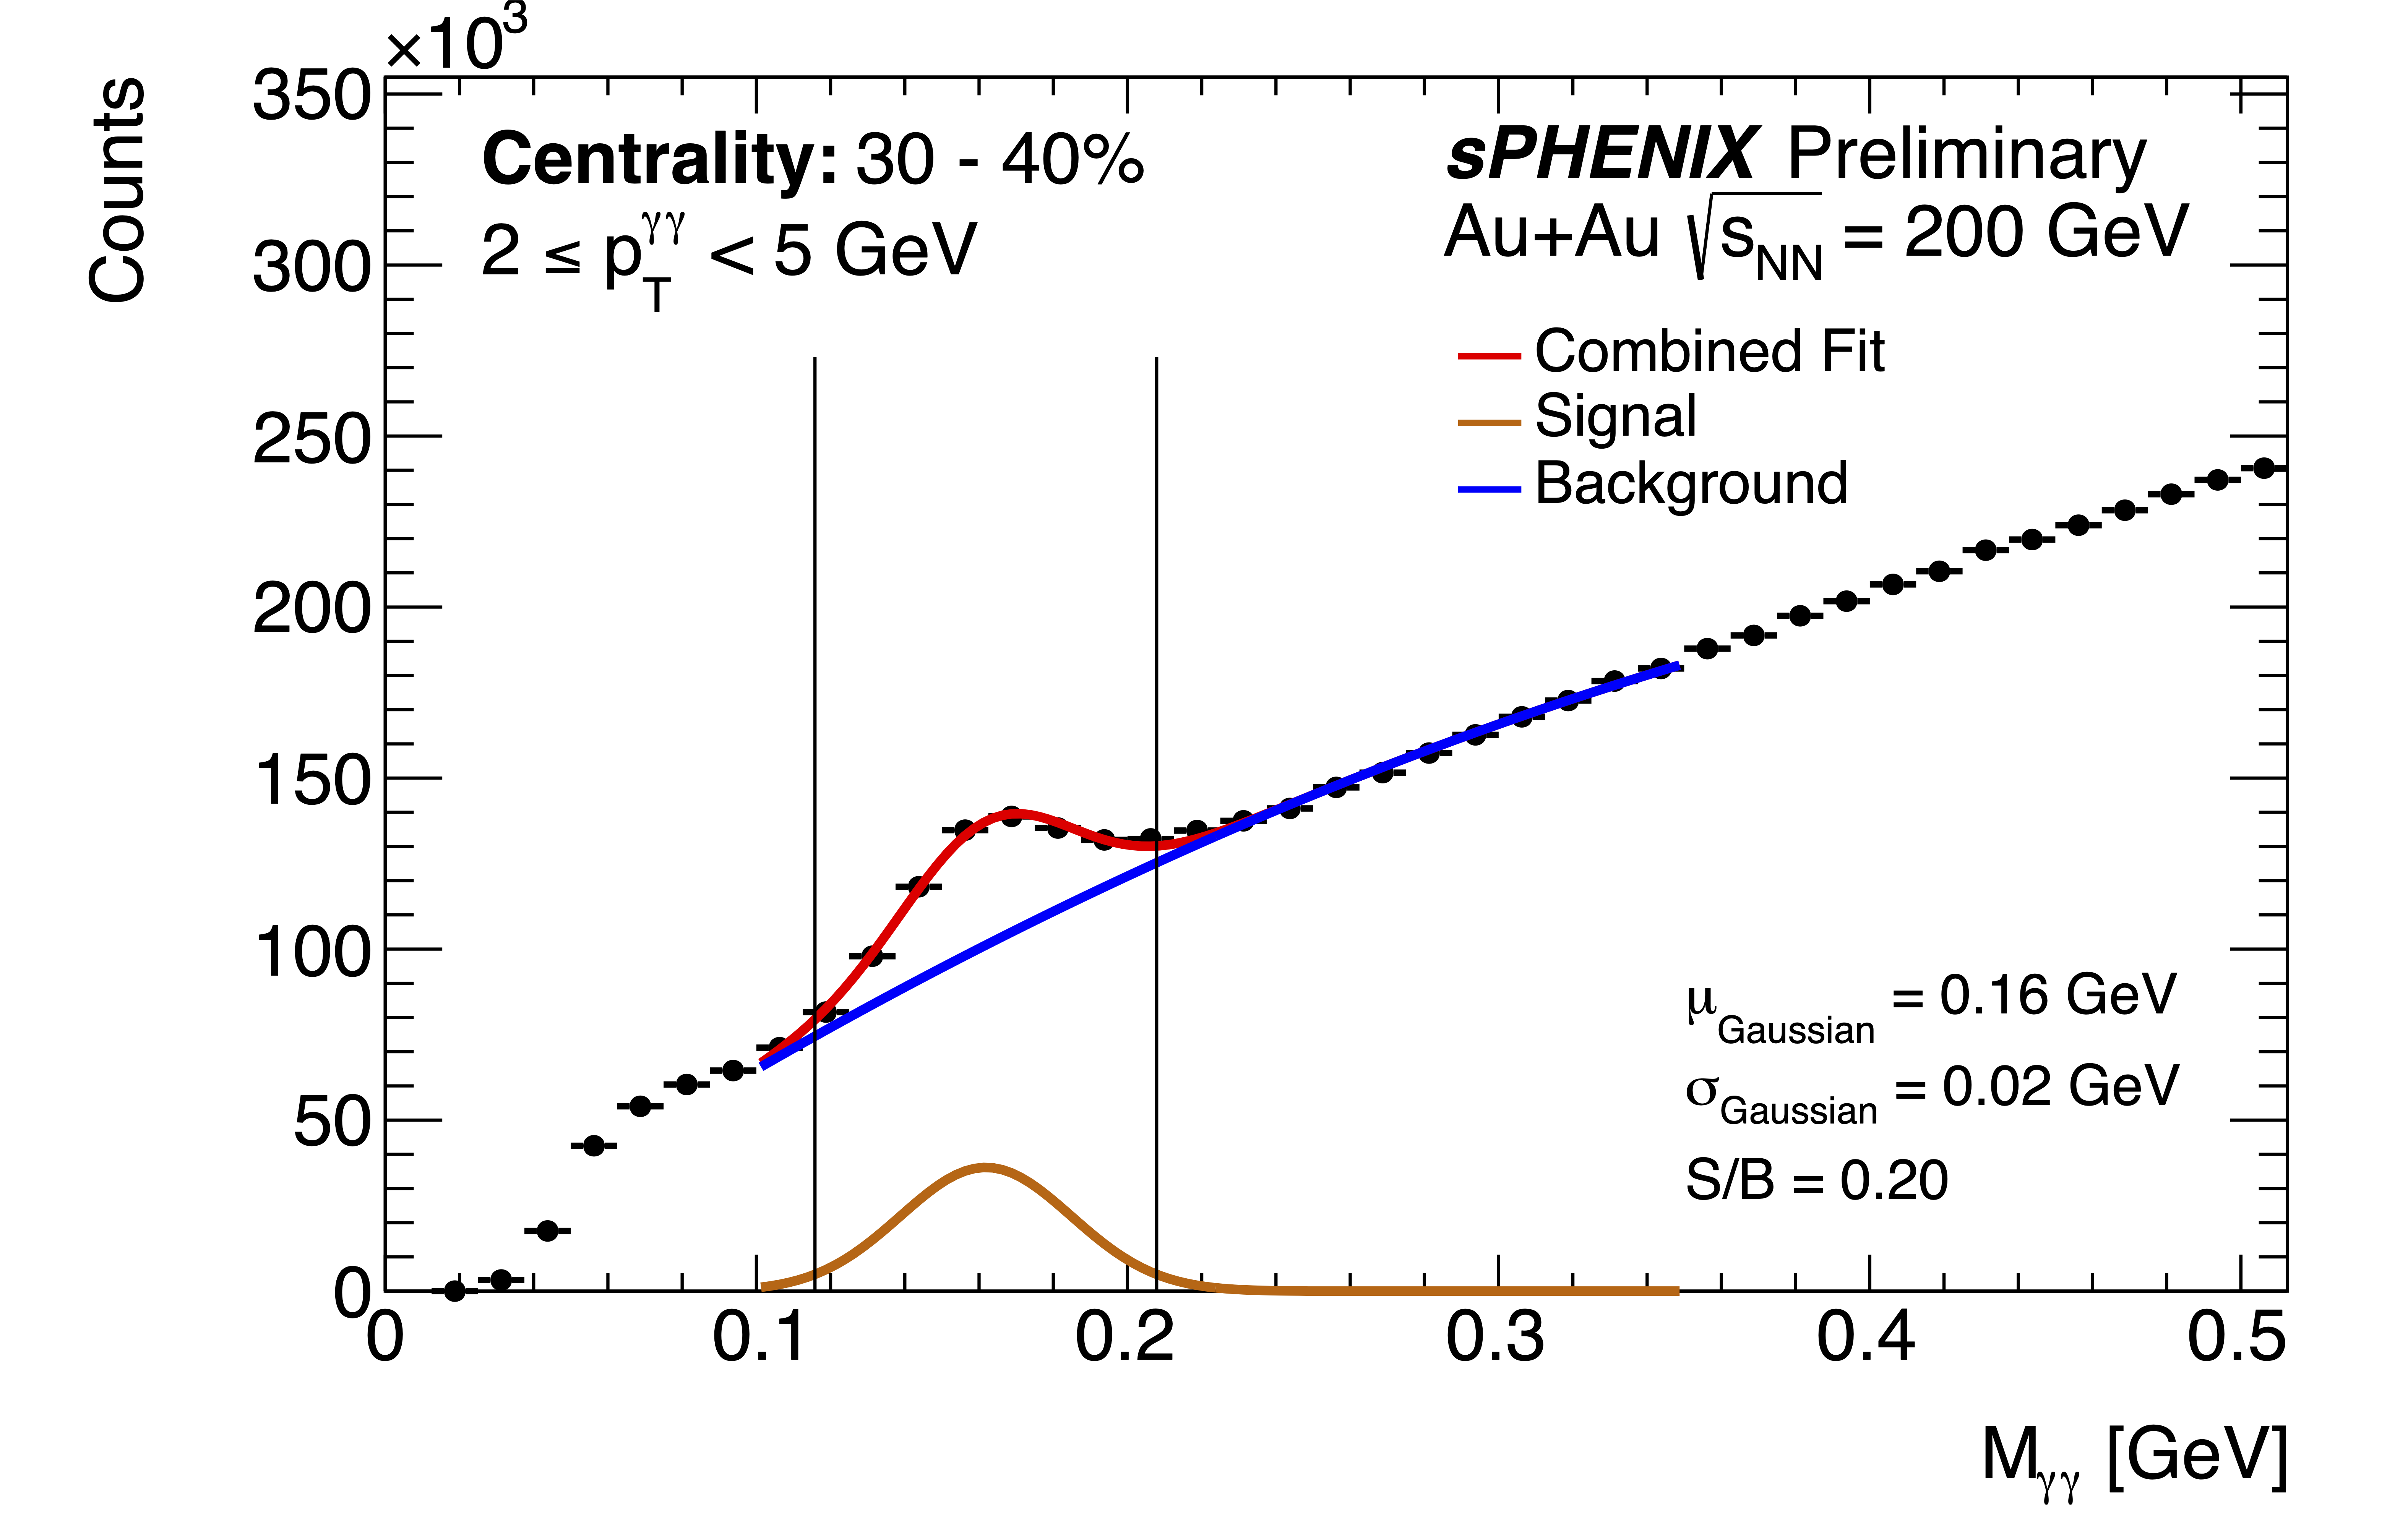
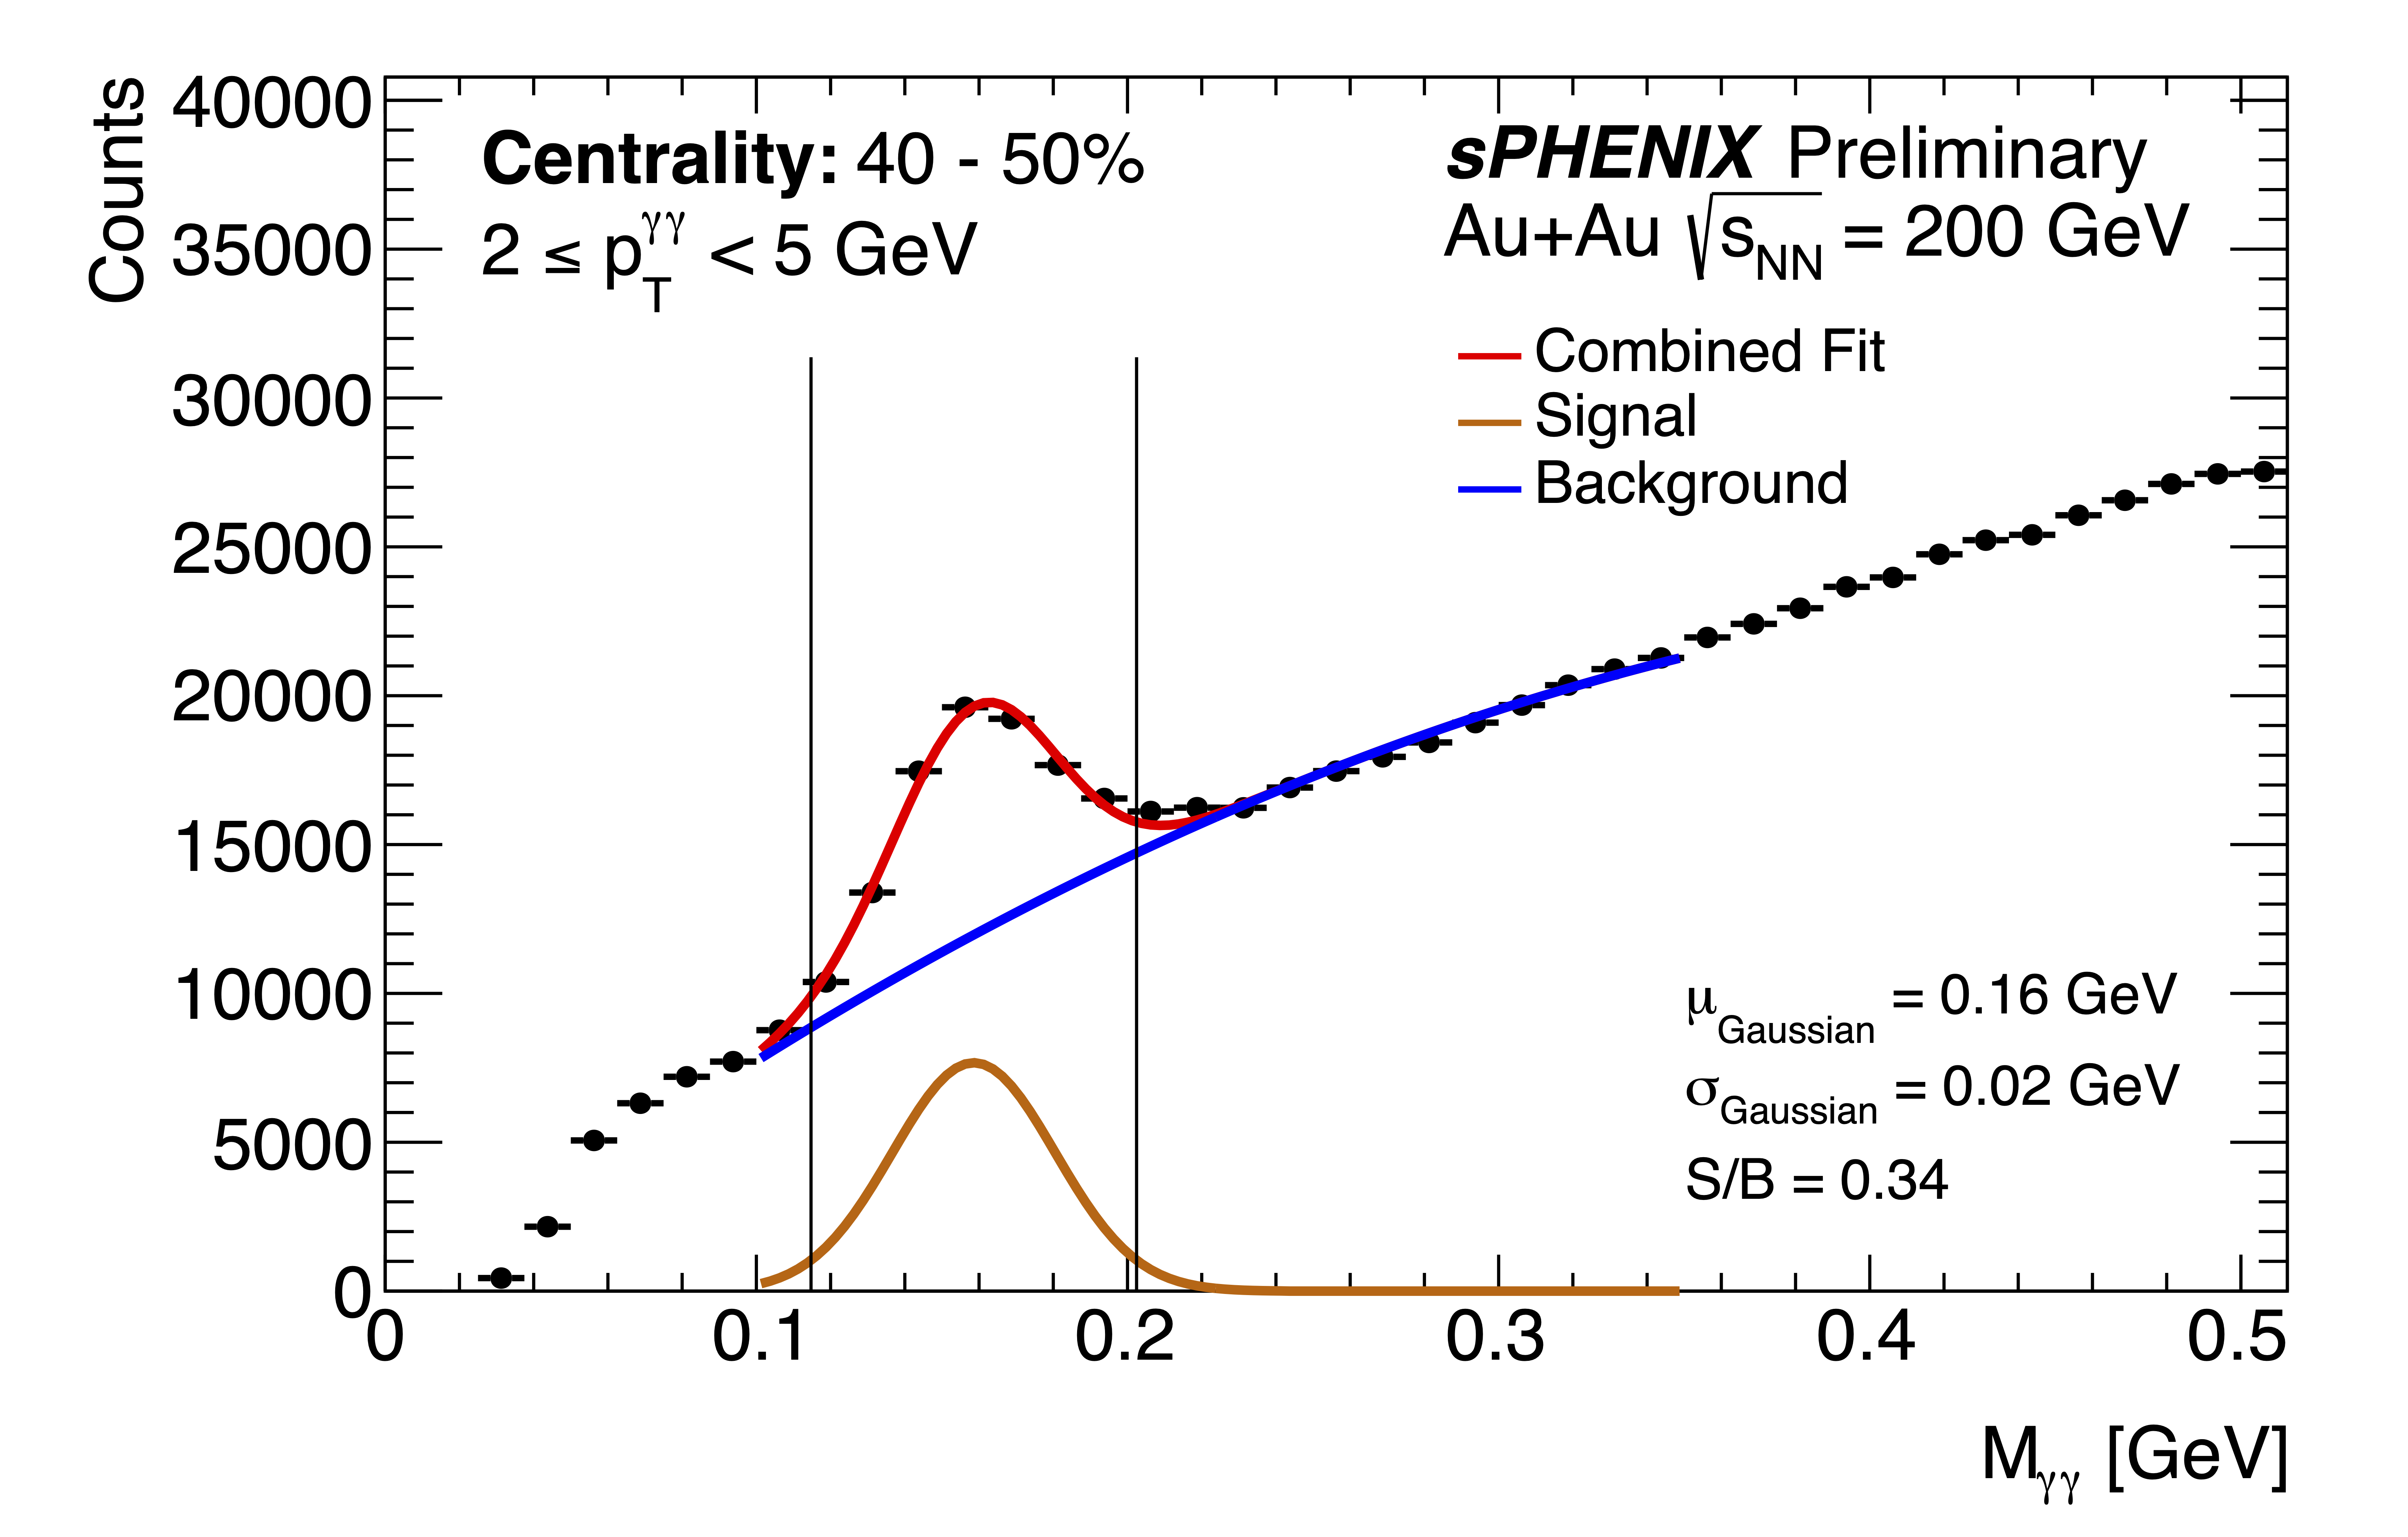
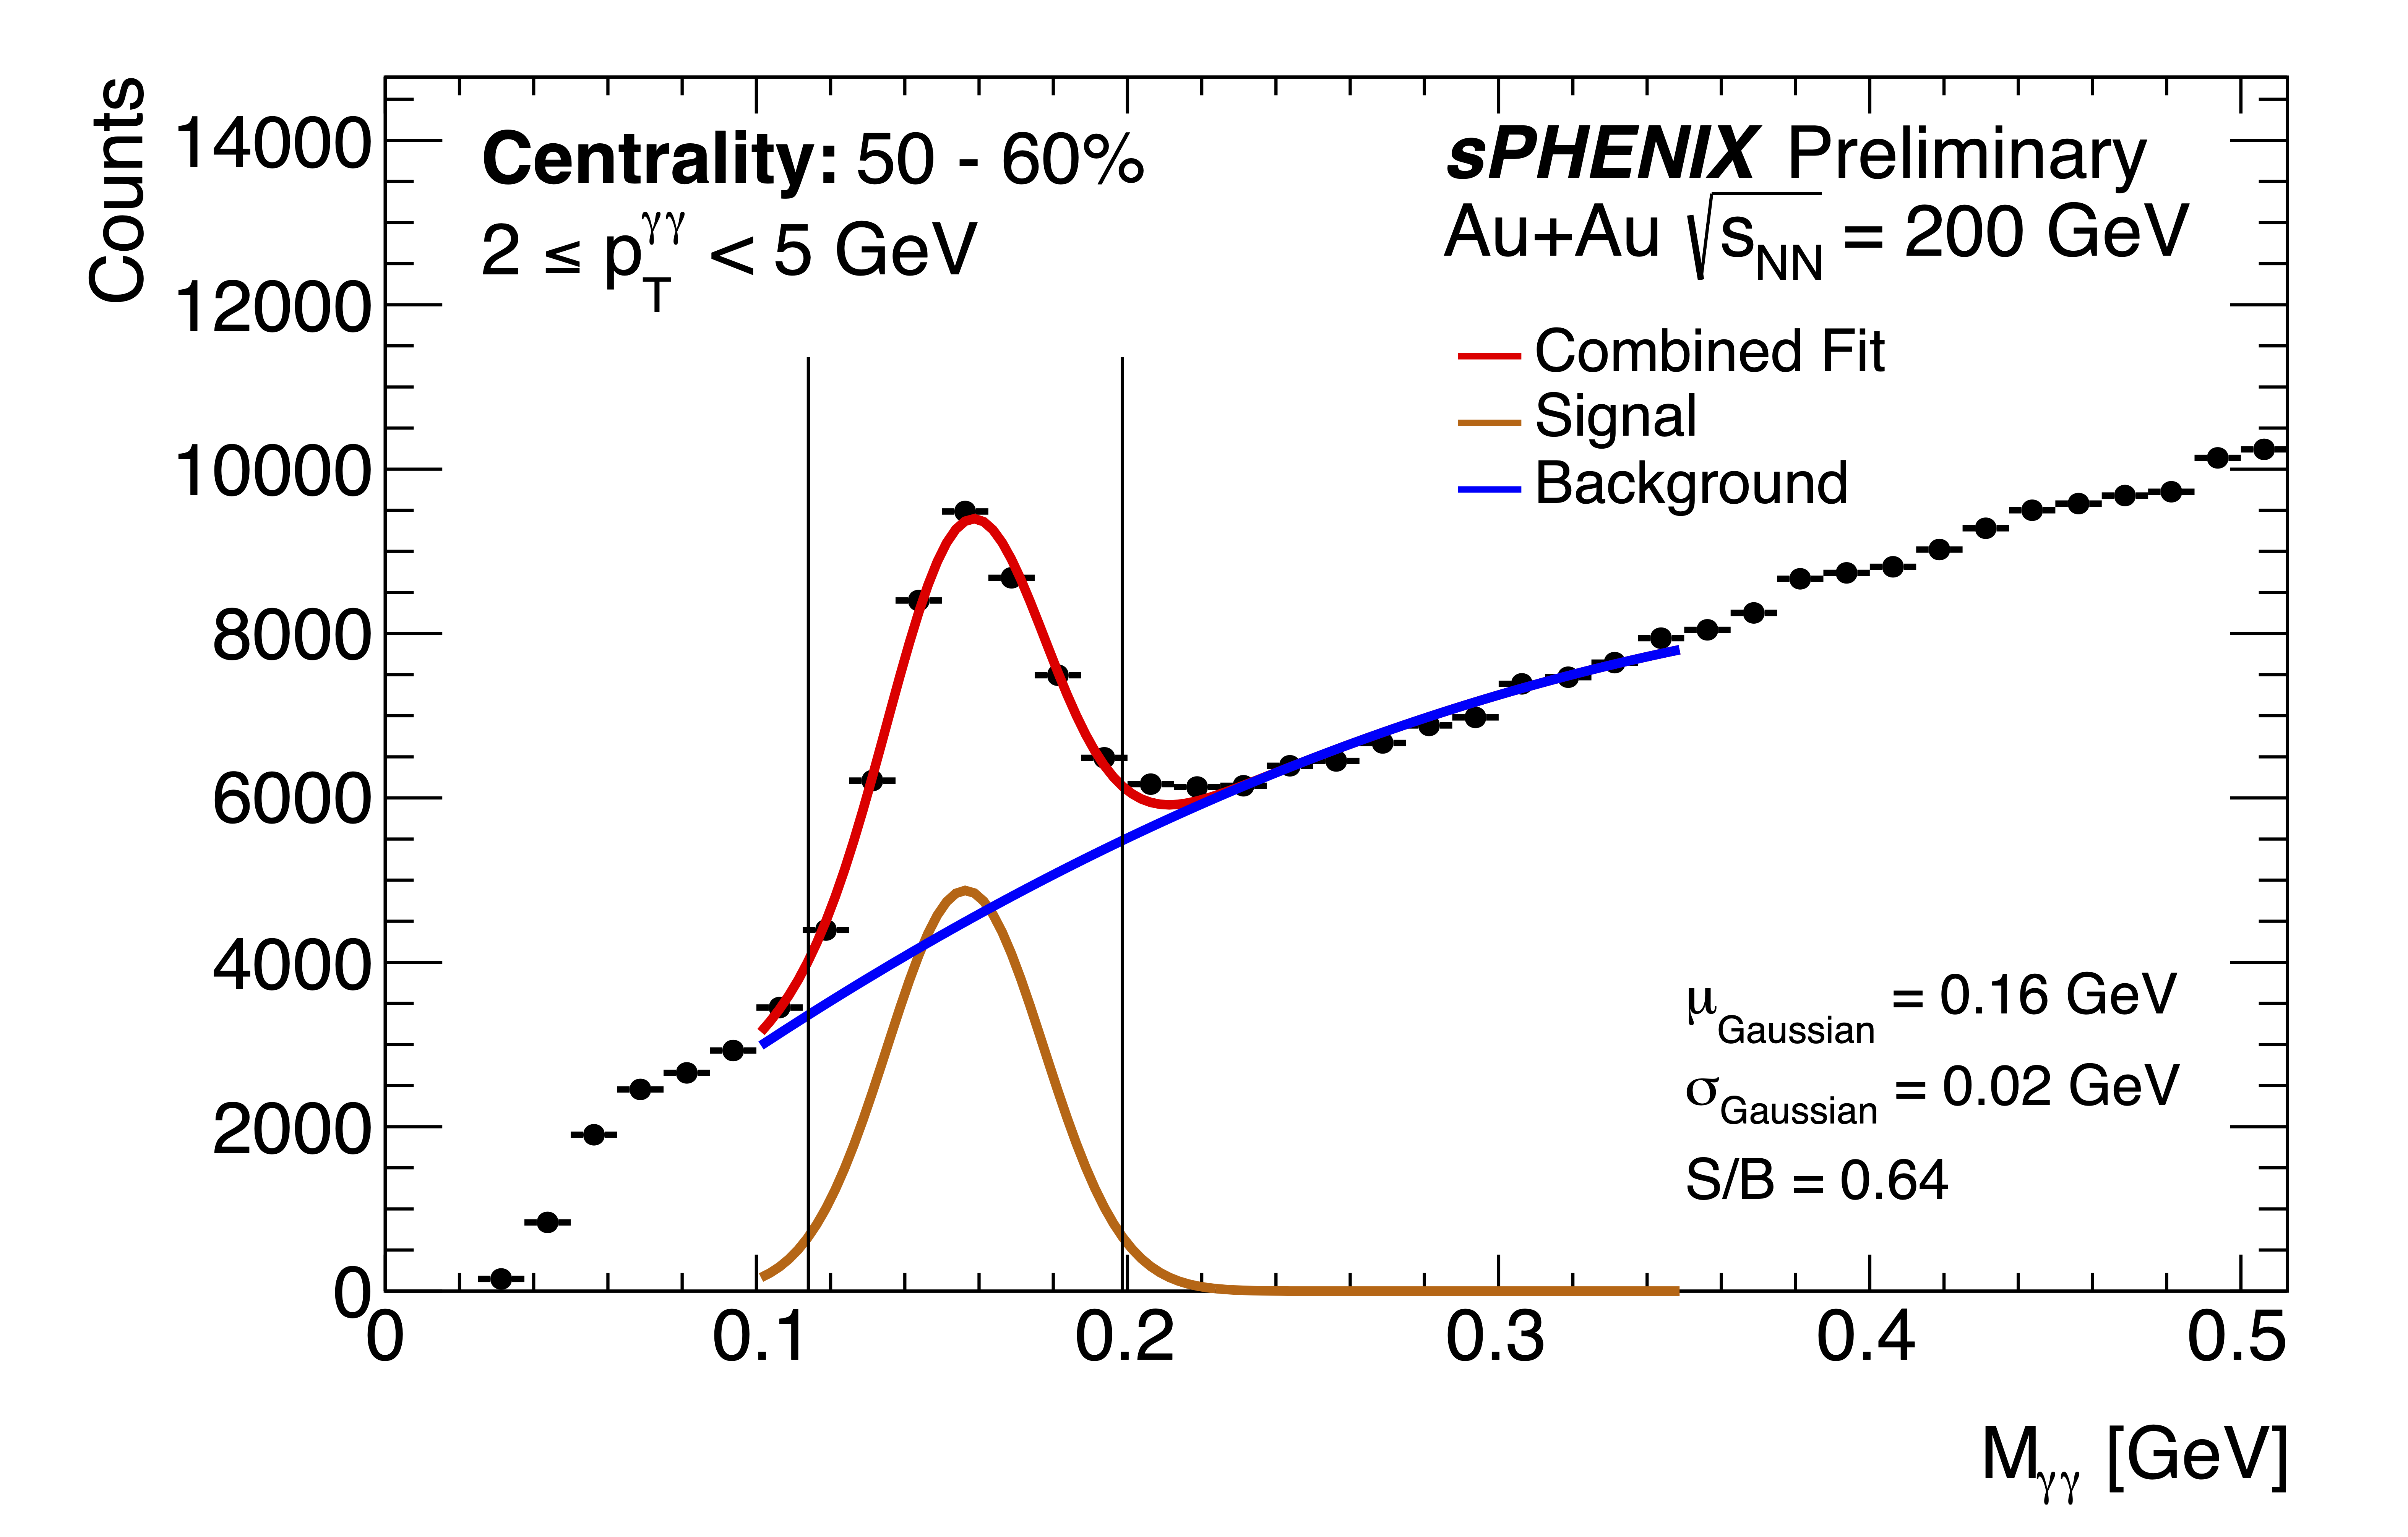
| Figure 1 |
|
| Invariant mass distributions for each centrality bin. The red curve is the total fit, the orange curve is the Gaussian used to fit the signal, and the blue curve is the polynomial used to fit the combinatorial background. The insets show the fitted mass peak after background subtraction. The uncertainties in these invariant mass distributions are statistical only. |
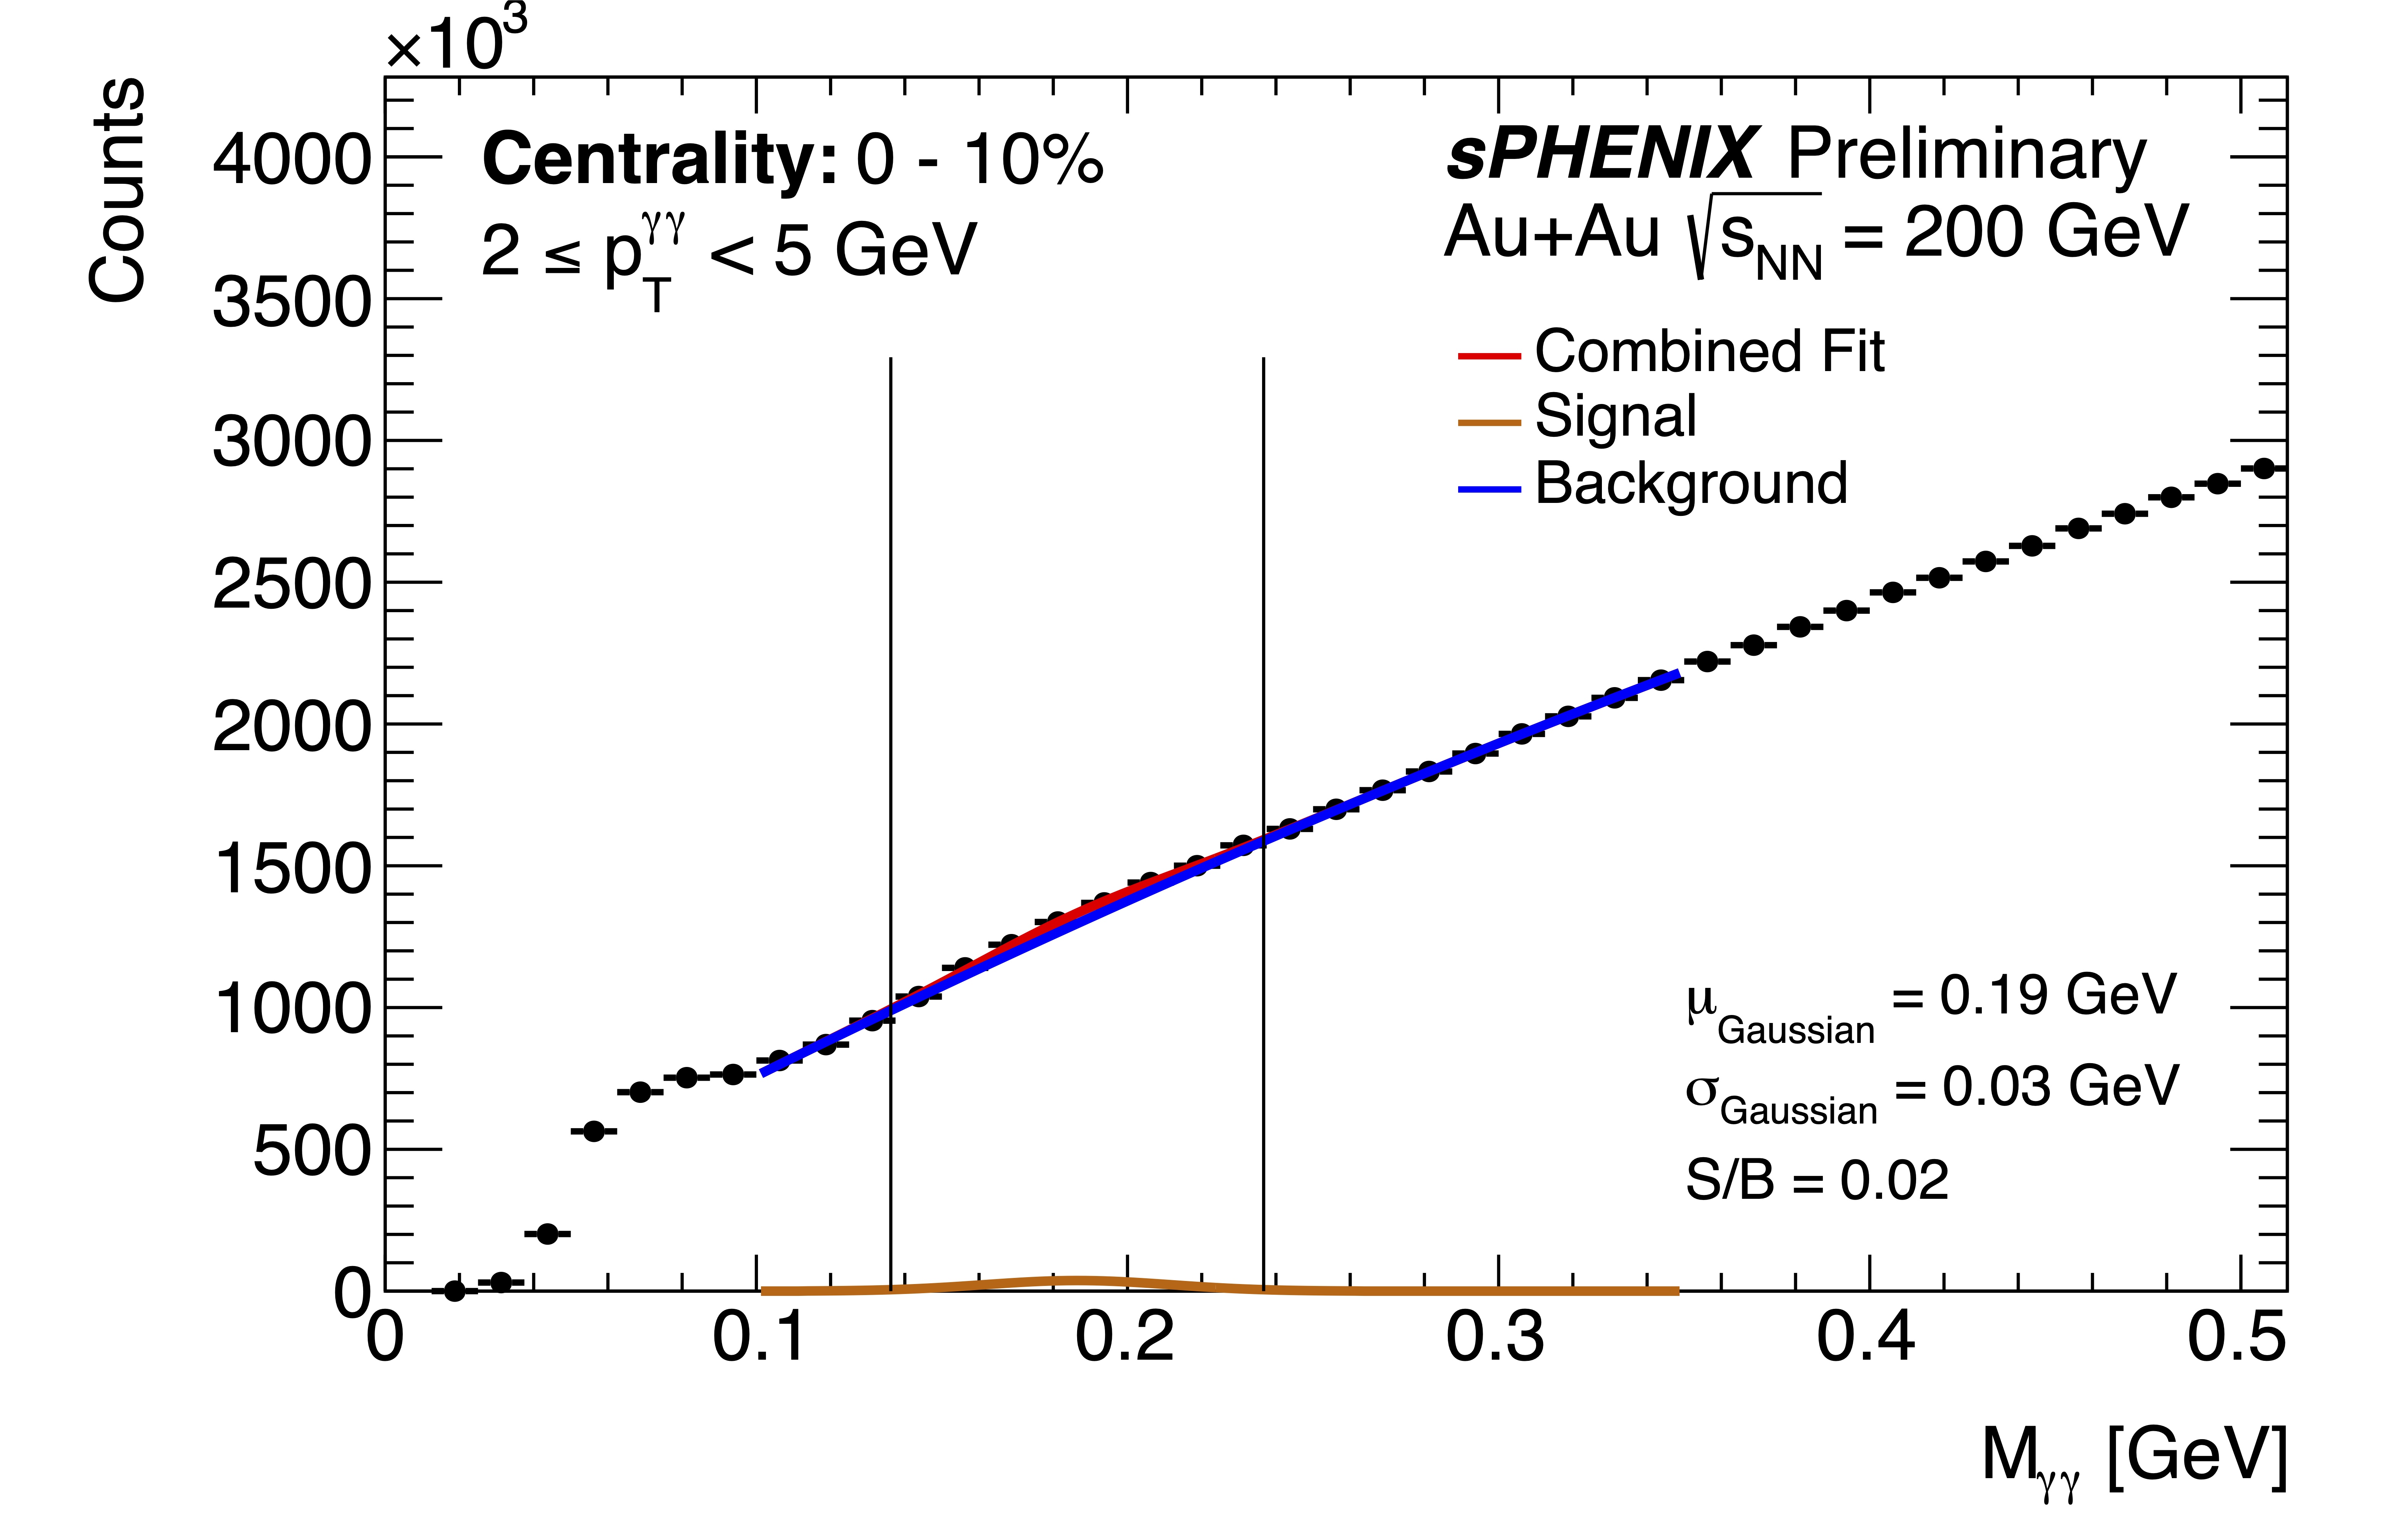
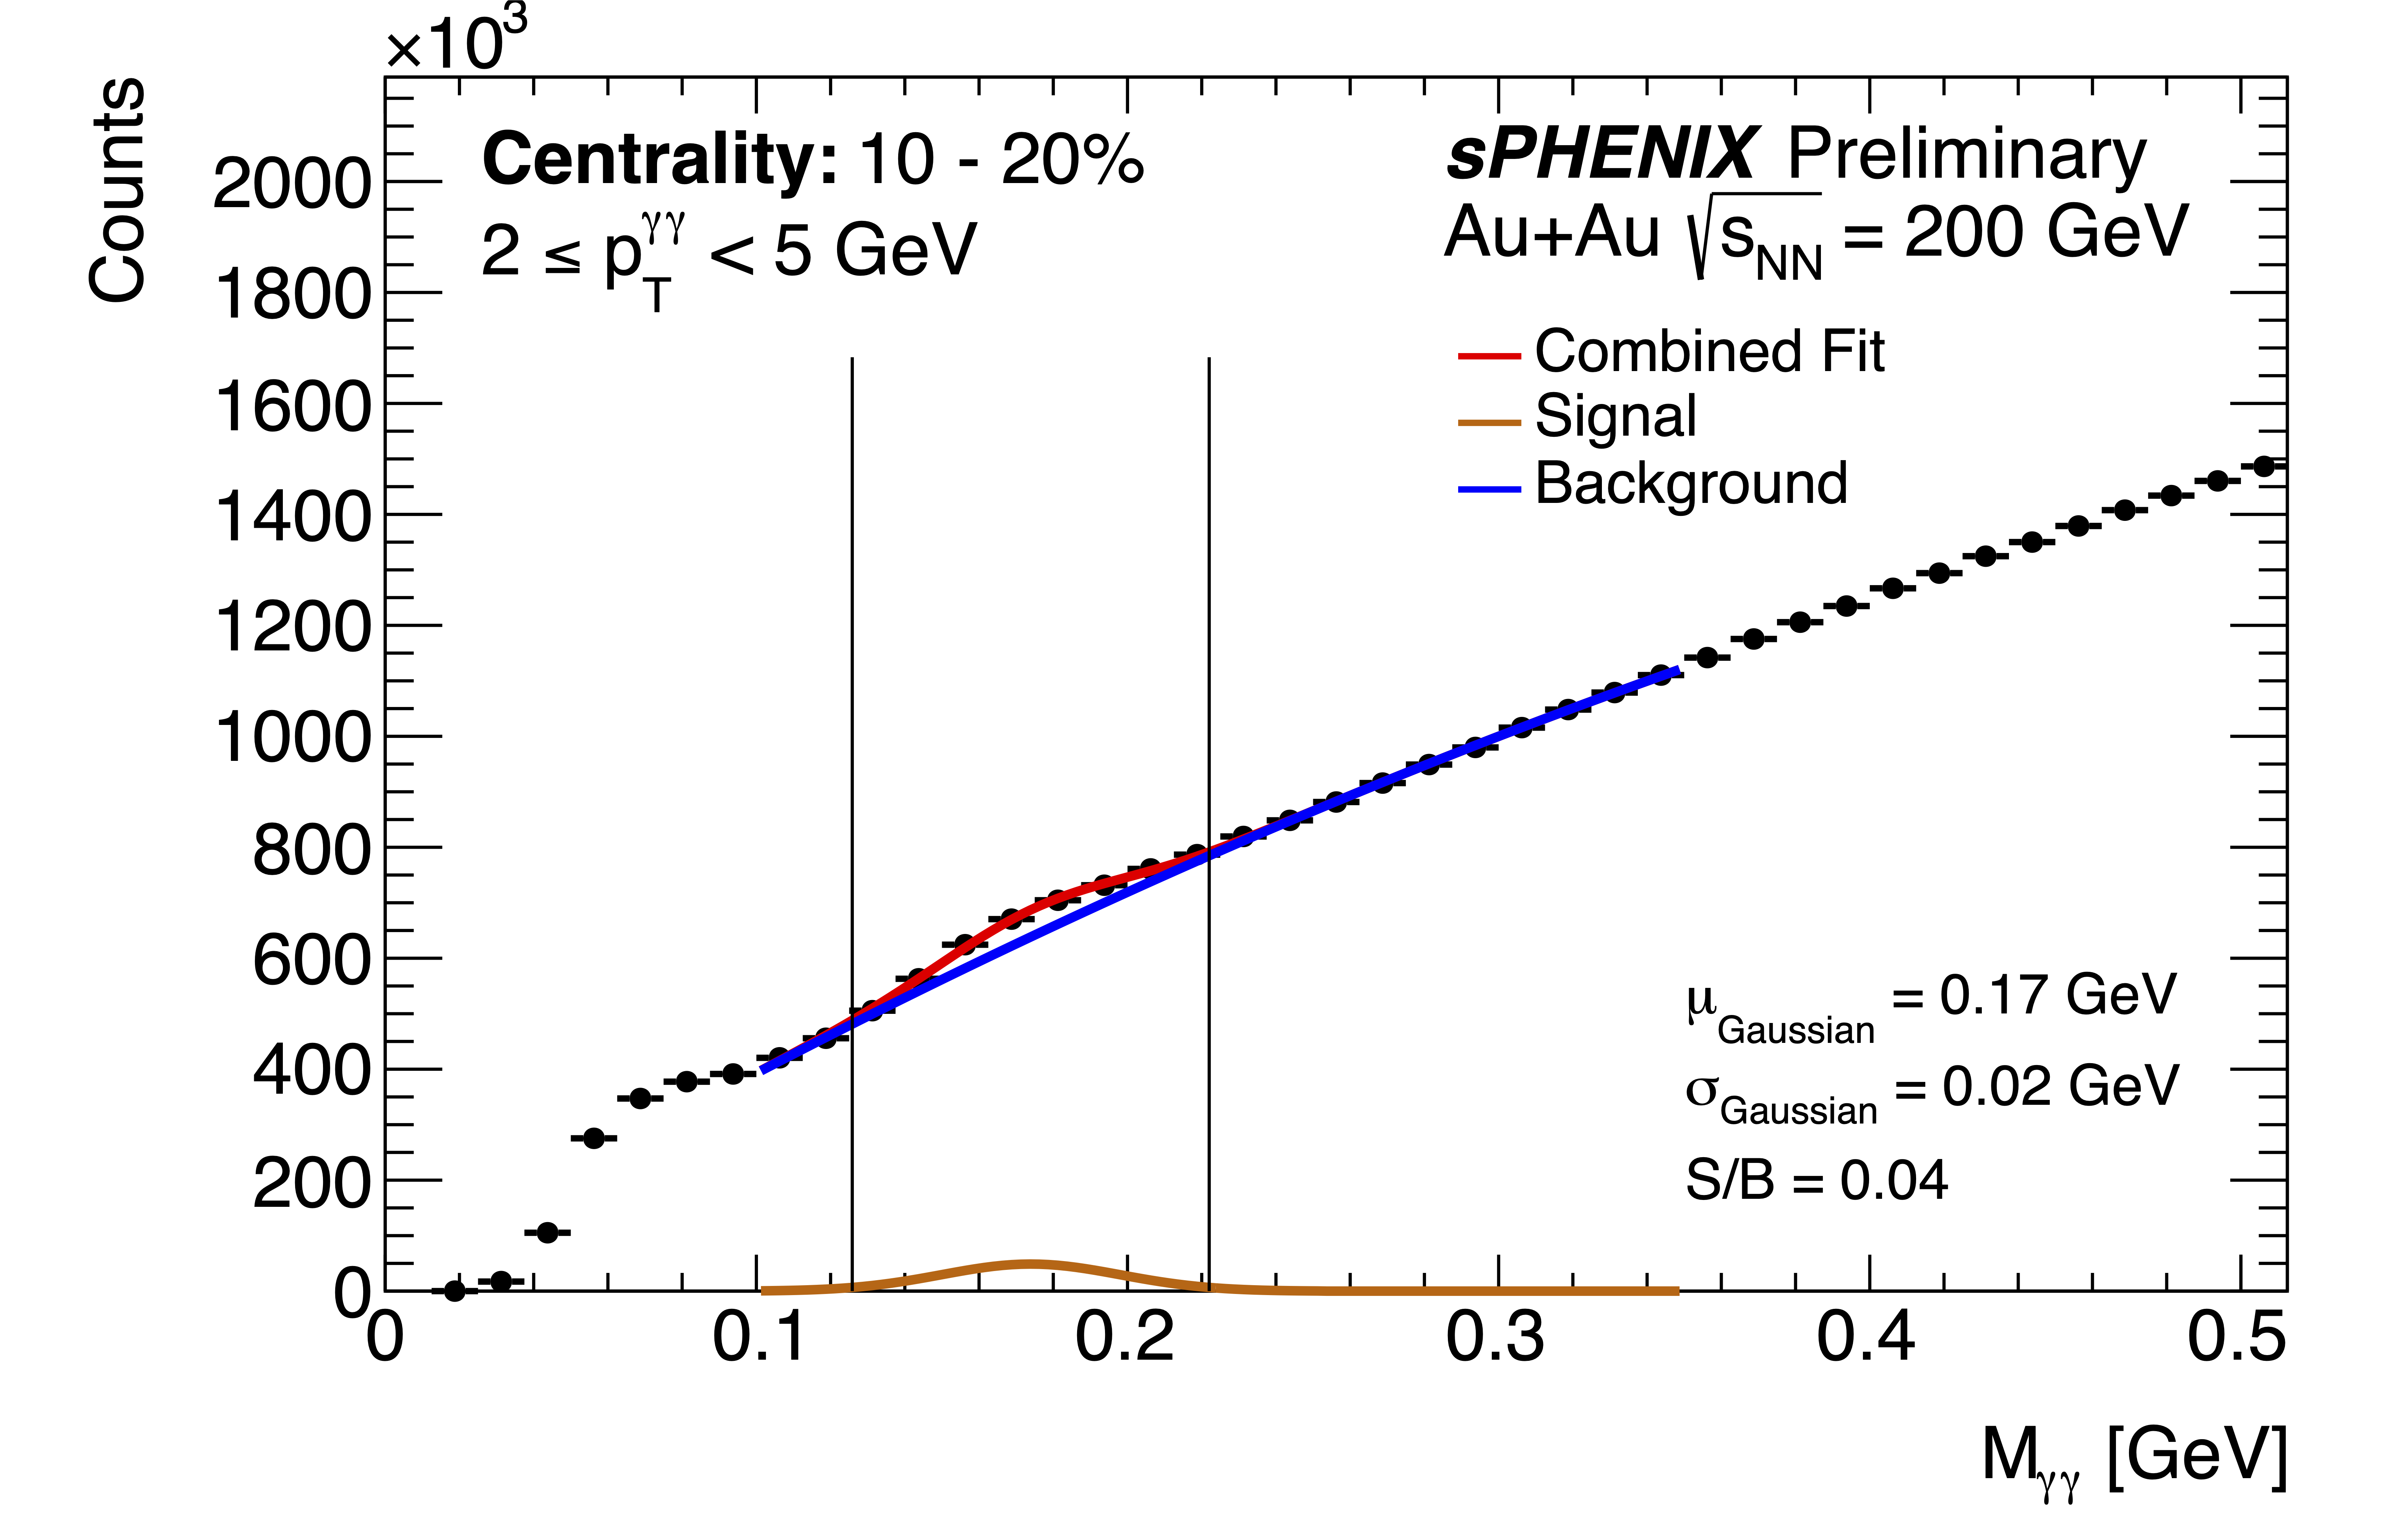
| Figure 1, No Inset |
|
| Invariant mass distributions for each centrality bin. The red curve is the total fit, the orange curve is the Gaussian used to fit the signal, and the blue curve is the polynomial used to fit the combinatorial background. The uncertainties in these invariant mass distributions are statistical only. |
| Figure 2 |
|
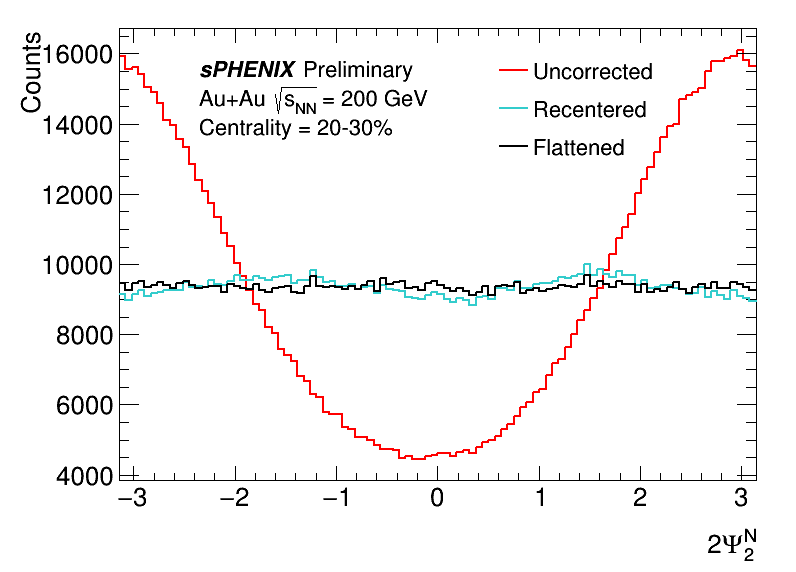
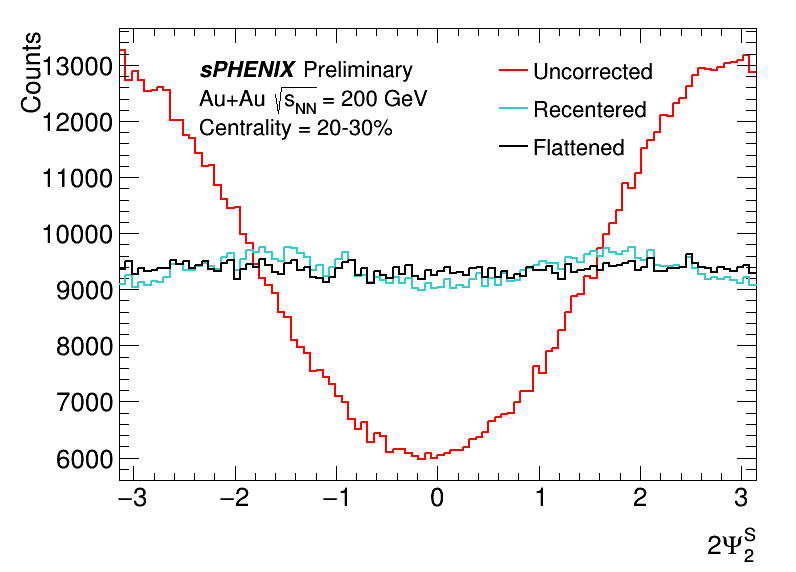
| Event plane angles from the North (a) and South (b) arms of the MBD. Red shows the distribution of uncorrected Ψ2, and the blue and black lines show the distribution of Ψ2 calculated with flow vectors that have been corrected with the recentering correction and both the recentering and flattening corrections, respectively. |
| Figure 3 |
|
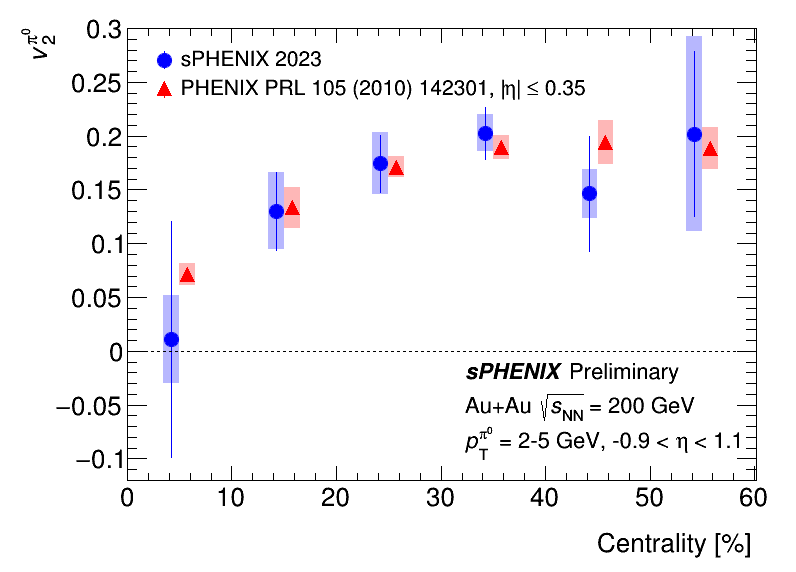
| v2π0 as a function of centrality, integrated over the range of 2 ≥ pT ≥ 5 GeV. The results, shown in blue with both statistical and systematic uncertainties, are offset to the left, while PHENIX data (pT-integrated), shown in red, is displaced to the right in each centrality bin for visibility |