Date: 1 April 2025
Tag: sPH-BULK-2025-01
Document: arXiv preprint, JHEP 08 (2025) 075
(Back to sPHENIX Public Results page.)
Table 1 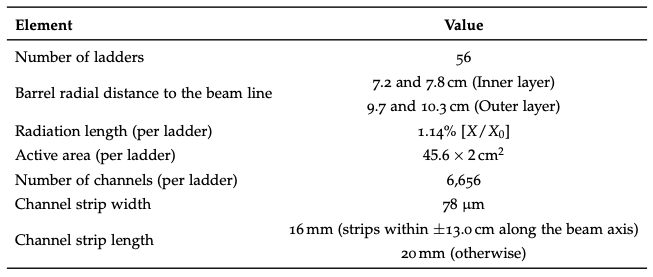
Specification of the sPHENIX Intermediate Silicon Tracker (INTT). |
Figure 1 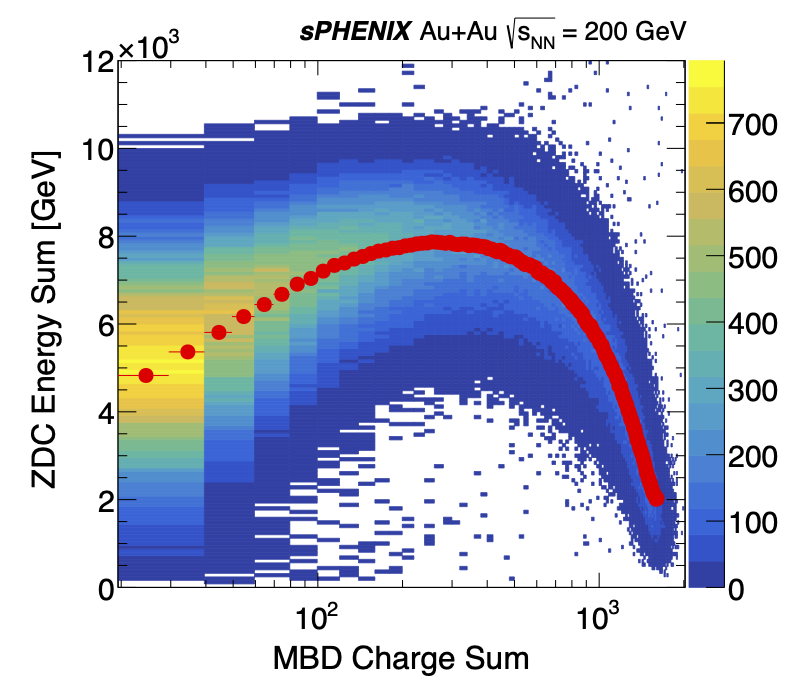
The correlation between the total energy in ZDCs and the MBD charge sum is shown. The MBD charge sum is in units of calibrated MIPs. The red points indicate the average ZDC energy as a function of MBD charge sum. |
Figure 2 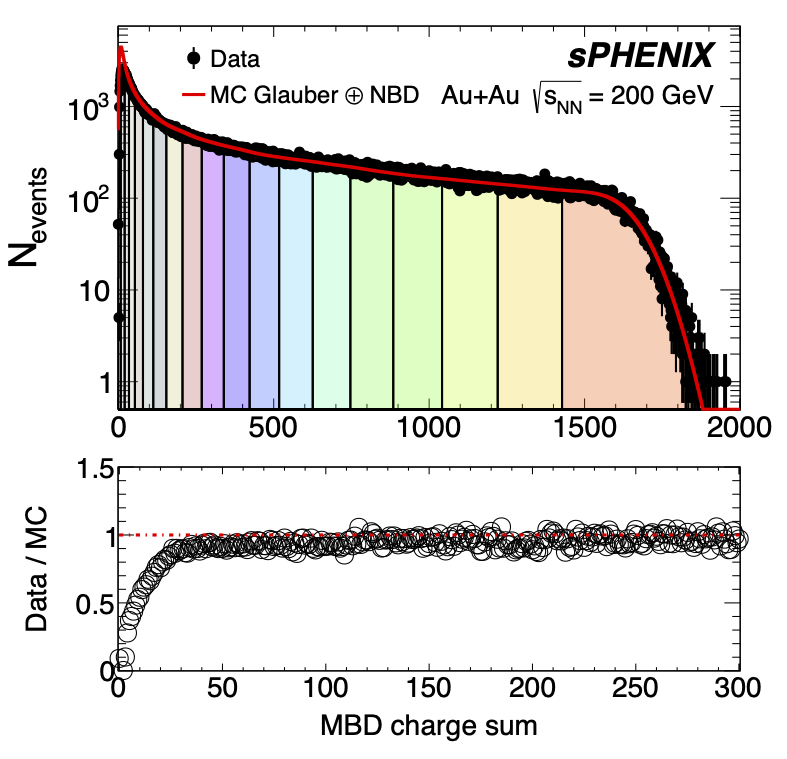
Top panel: the distribution of total charge deposited in the MBD (solid black circles), the best fit of an MC Glauber model convolved with an NBD (red line), and centrality intervals for the MB events of Au+Au collisions at √sNN = 200 GeV collected with zero magnetic field (shaded regions). Bottom panel: the trigger efficiency as a function of the MBD charge deposit in the peripheral collision region. |
Table 2 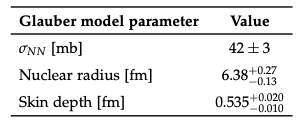
Glauber model parameters for Au+Au collisions at √sNN = 200 GeV. |
Figure 3 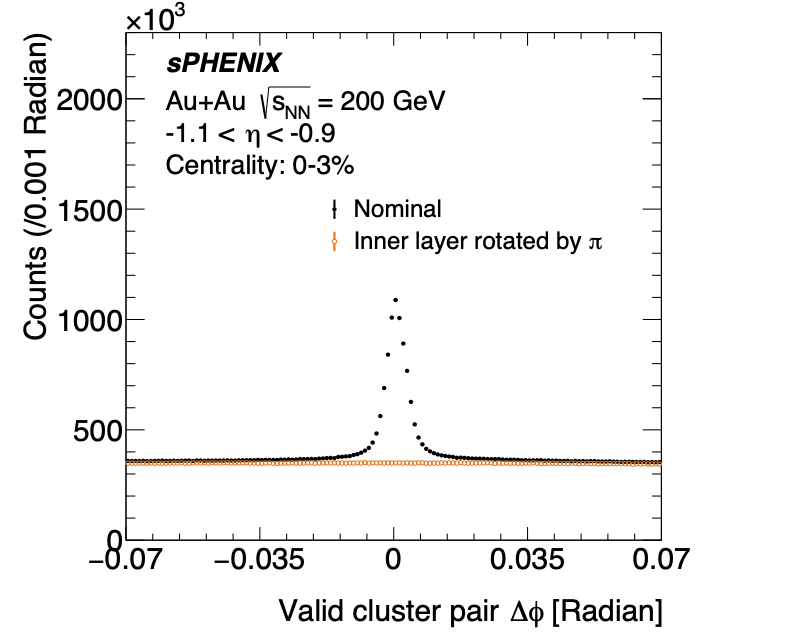
The Δφ distributions for valid cluster pairs in a representative η and centrality interval. The solid black circles indicate the distribution of all valid cluster pairs, while the open orange circles represent the estimated combinatorial background, obtained by rotating the inner-layer ladders by π around the beam axis. |
Figure 4 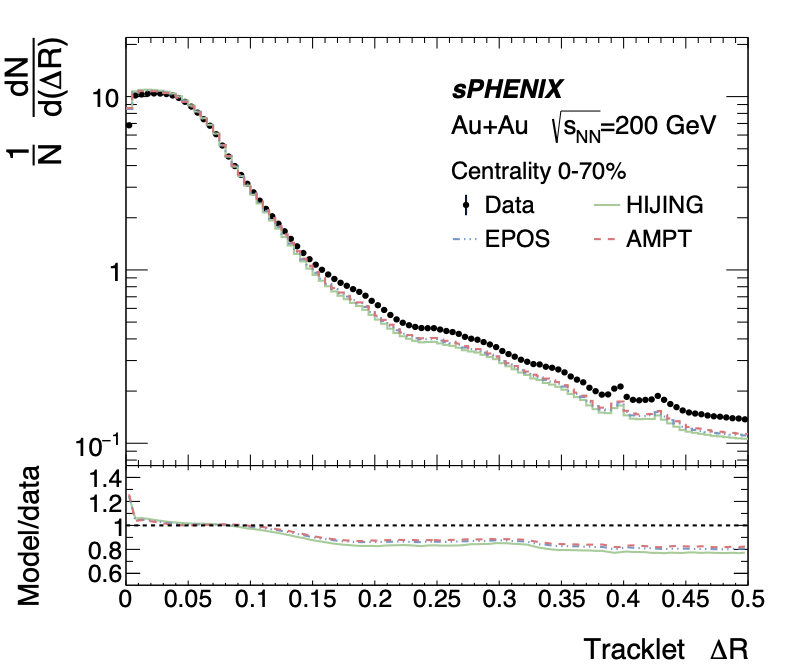
The ΔR distributions for reconstructed tracklets, normalised by the total number of tracklets. The spectrum in data (black circle) is compared to simulations generated with HIJING, EPOS, and AMPT. |
Table 3 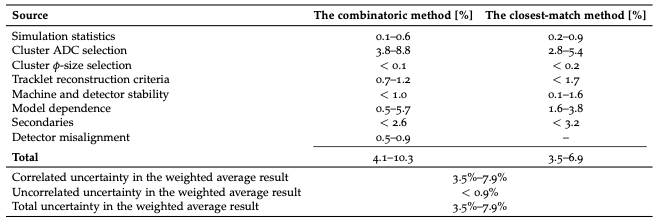
Systematic uncertainties from various sources are reported, with the range indicating the minimum and maximum uncertainty magnitudes across all η bins and centrality intervals. Additionally, the correlated and uncorrelated uncertainties of the weighted average result, as detailed in Section 6, are provided. |
Figure 5 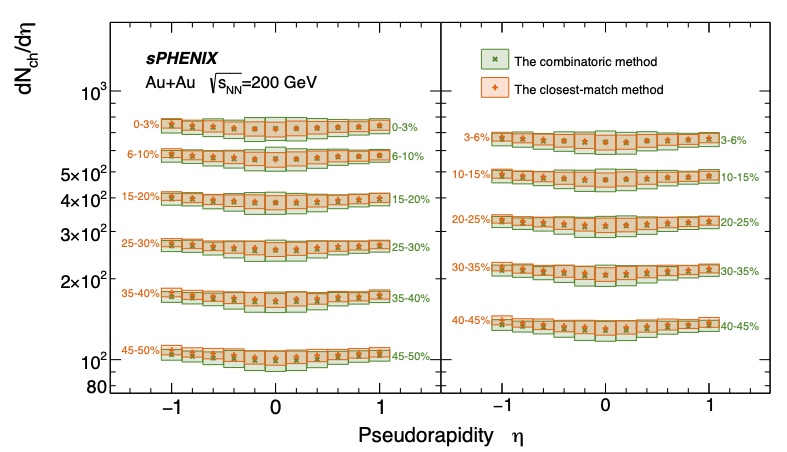
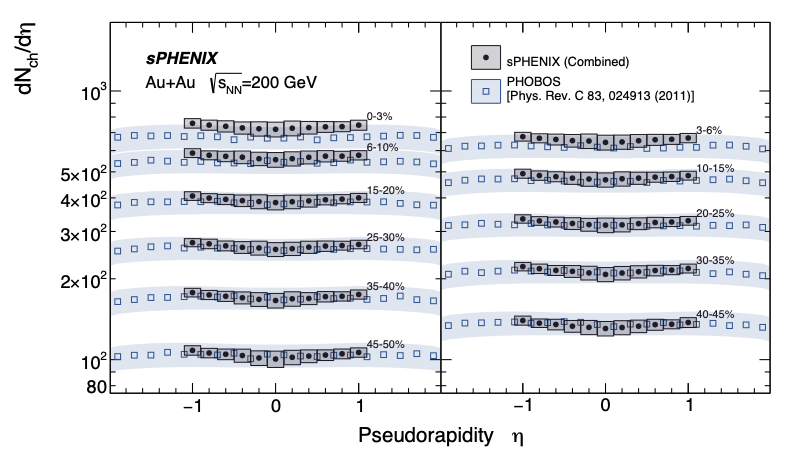
Top: Corrected dNch/dη measurements from the combinatoric method (green solid crosses and green transparent filled boxes) and the closest-match method (orange solid pluses and transparent filled boxes) as a function of η over the measurement range |η| < 1.1, spanning from 0–3% central to 45–50% mid-central Au+Au events. The vertical extent of each box represents the total systematic uncertainty for each analysis method, obtained by summing all sources in quadrature under the assumption that individual uncertainty sources are independent and uncorrelated. Bottom: dNch/dη measurements from the combination of both analysis methods (black solid circles and transparent filled boxes) as a function of η over the range |η| < 1.1, covering centralities from 0–3% to 45–50% in Au+Au collisions. The vertical size of each box represents the full combined uncertainty, calculated using the procedure outlined above. For comparison, PHOBOS measurements in the same centrality classes are shown as blue open squares [11], with the filled area representing the total uncertainty. |
Figure 6 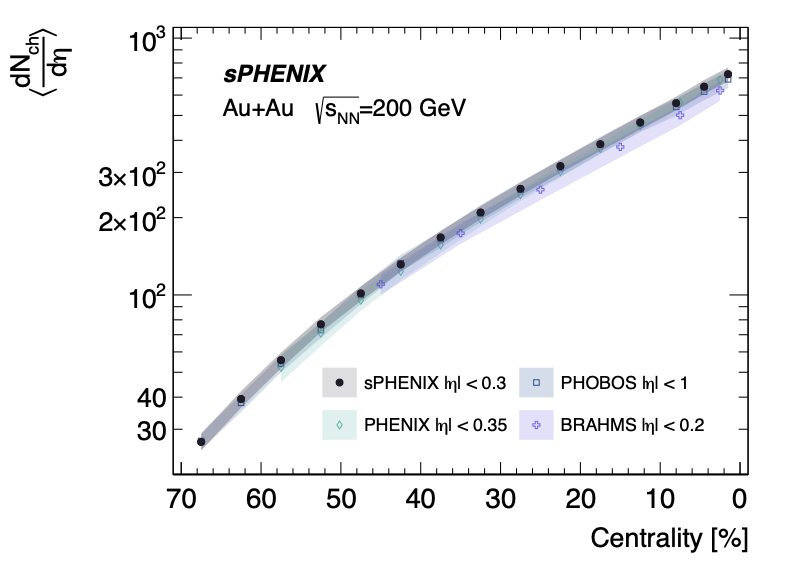
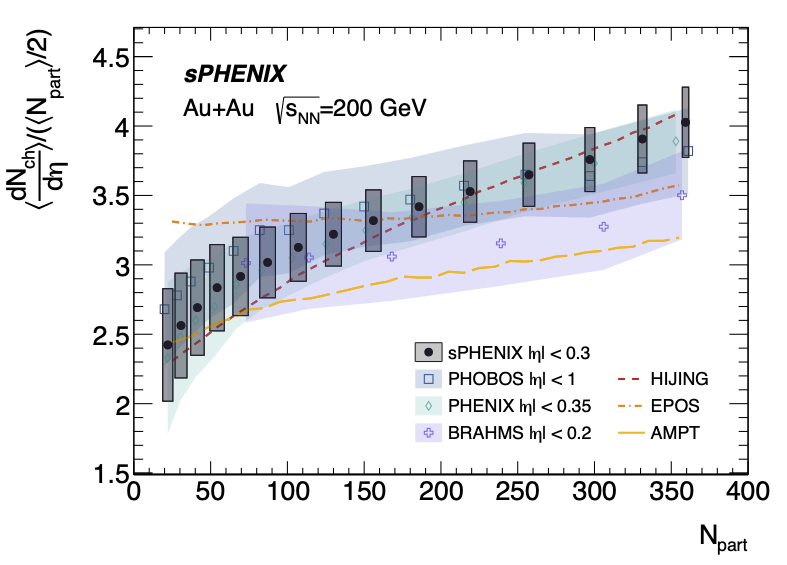
The sPHENIX results are shown as black solid circles with transparent filled band/boxes indicating total uncertainties, while data from PHOBOS (blue open squares) [11], PHENIX (cyan open diamonds) [8], and BRAHMS (purple open crosses) [13] are presented for comparison. The colored bands represent the total systematic uncertainty for each presented measurement. Left: sPHENIX combined dNch/dη at mid-rapidity, averaged over |η| < 0.3, as a function of event centrality. Right: The average dNch/dη at mid-rapidity, normalised by the number of participant pairs, as a function of the number of participating nucleons. |
Table 4 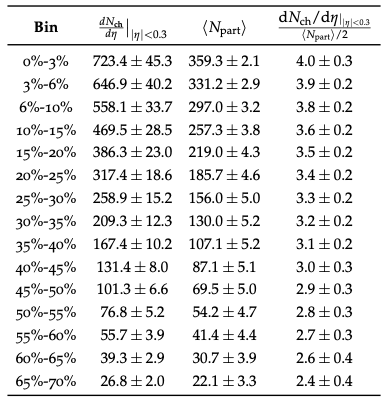
Summary of the midrapidity charged hadron multiplicities, the number of participants, and the charged hadron multiplicities normalised to the number of participant pairs <Npart>. |
Figure 6b, Alternatives 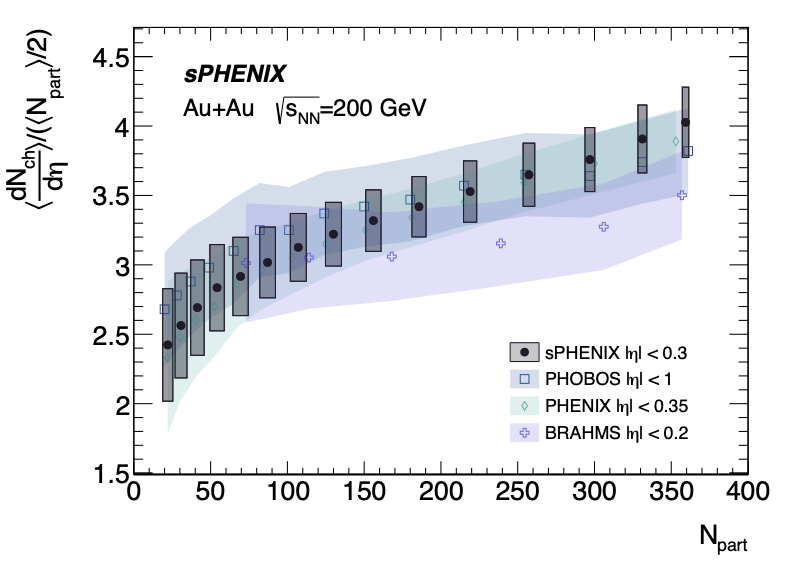
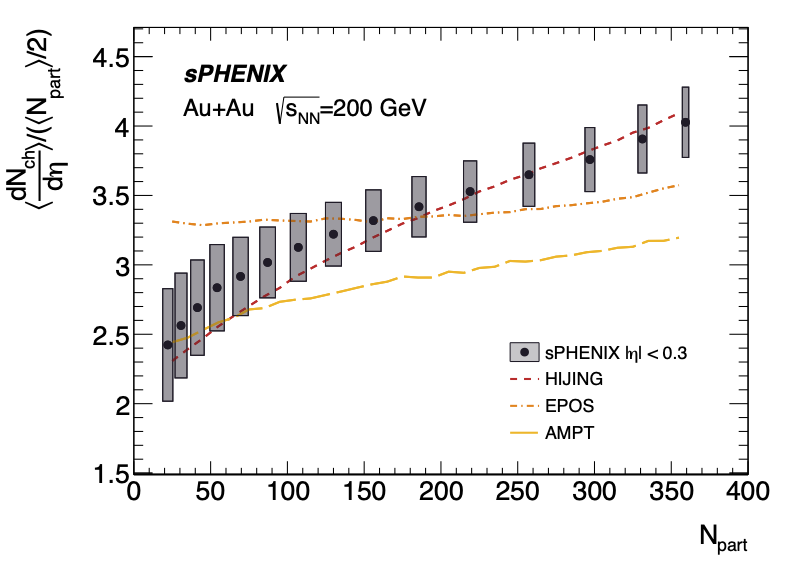
|