Date: 4 April 2025
Tag: sPH-CONF-JET-2025-03
Document: Conference Note
(Back to sPHENIX Public Results page.)
Figure 1 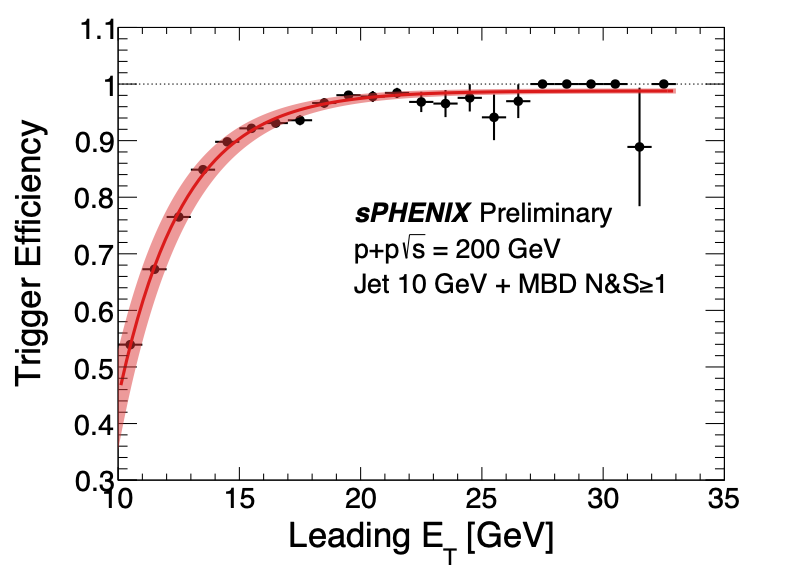
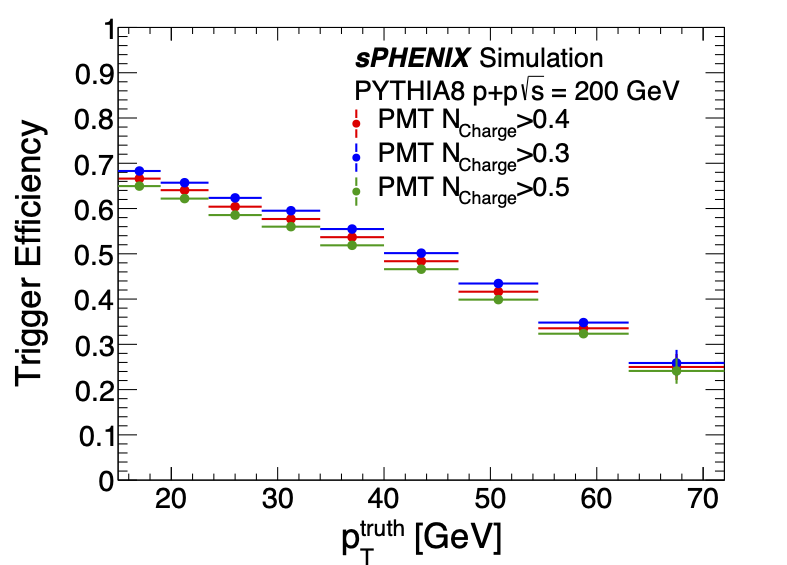
Left: Jet spectra from the 10 GeV trigger as a function of jet pT. The red line is a fit to the data, and the shaded region around the fit are the upper and lower fit variations based on the fit uncertainties. Right: Minimum bias trigger efficiency measured in simulation. The different color markers on the right represent different MBD charge requirements of > 0.3 (blue), > 0.4 (red) and > 0.5 (green). |
Figure 2 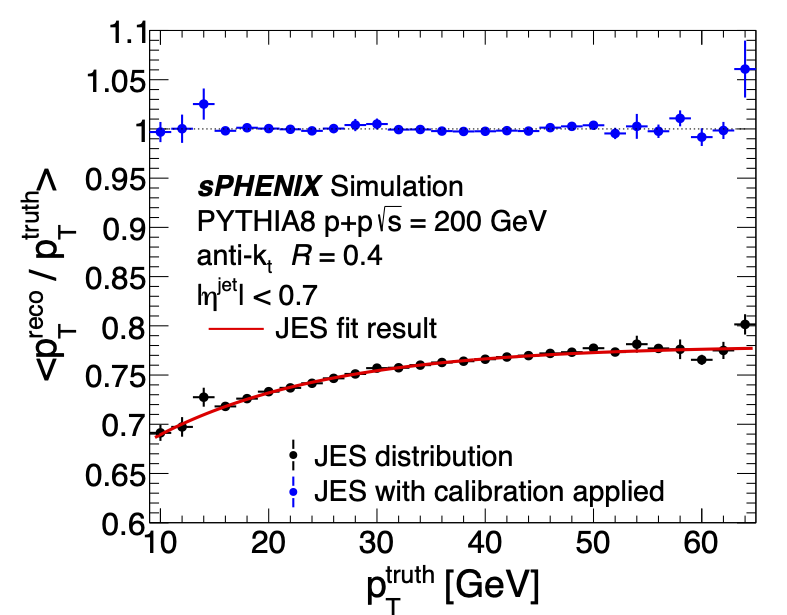
Black points: The uncalibrated JES as a function of pTtruth. Blue points: The JES as a function of pTtruth after the JES calibration has been applied. |
Figure 3 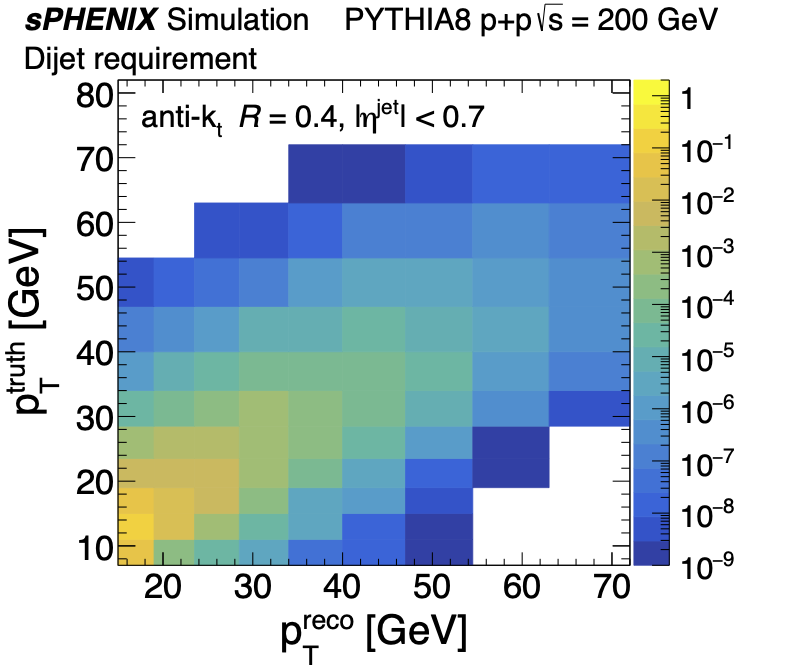
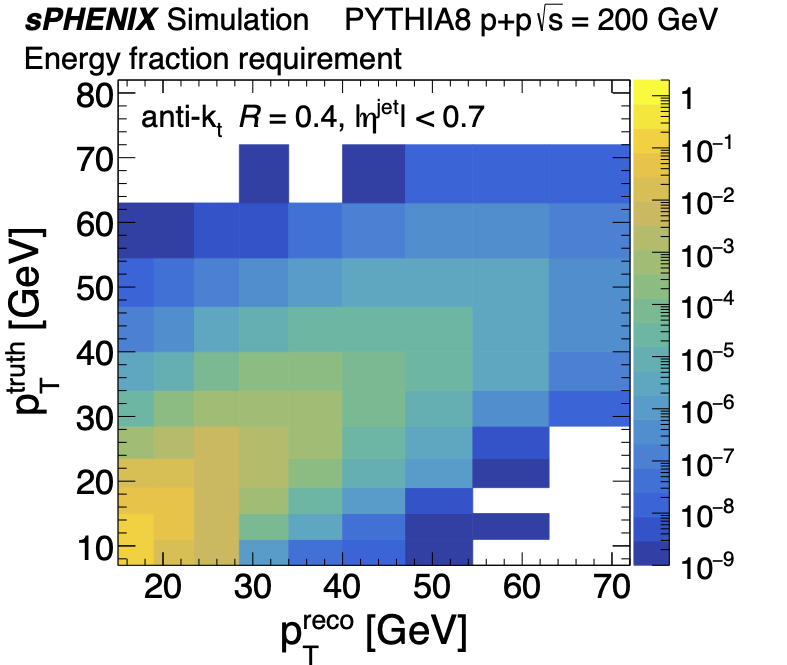
Response matrices used in the unfolding correction, with reconstructed jets after the JES calibration. The left and right plots are with the dijet method and with the energy fraction method, respectively, used to reject backgrounds as detailed in Section 4.2. |
Figure 4 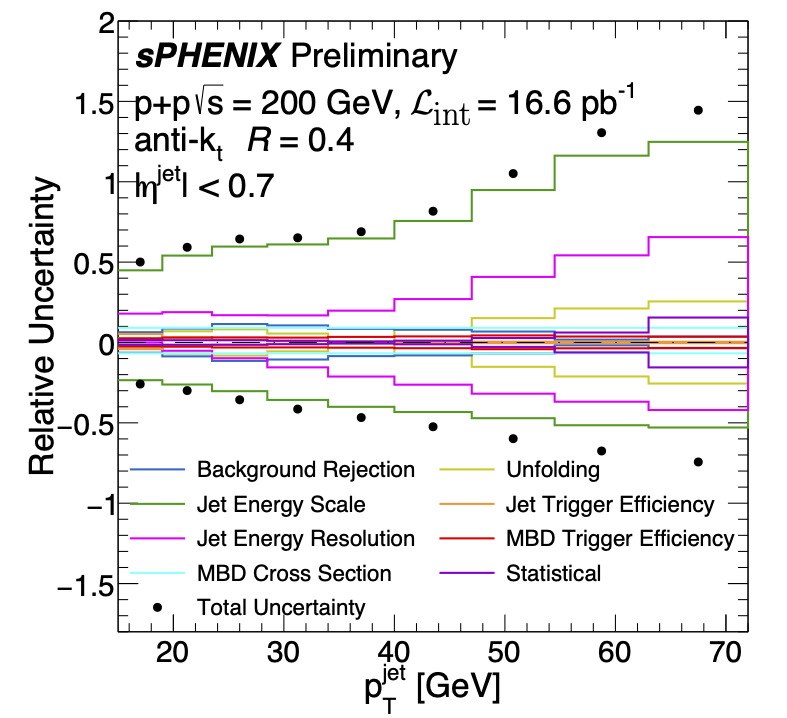
Summary of systematic uncertainties in the measurement, with each component shown as different color histograms and the total in black markers. |
Figure 5 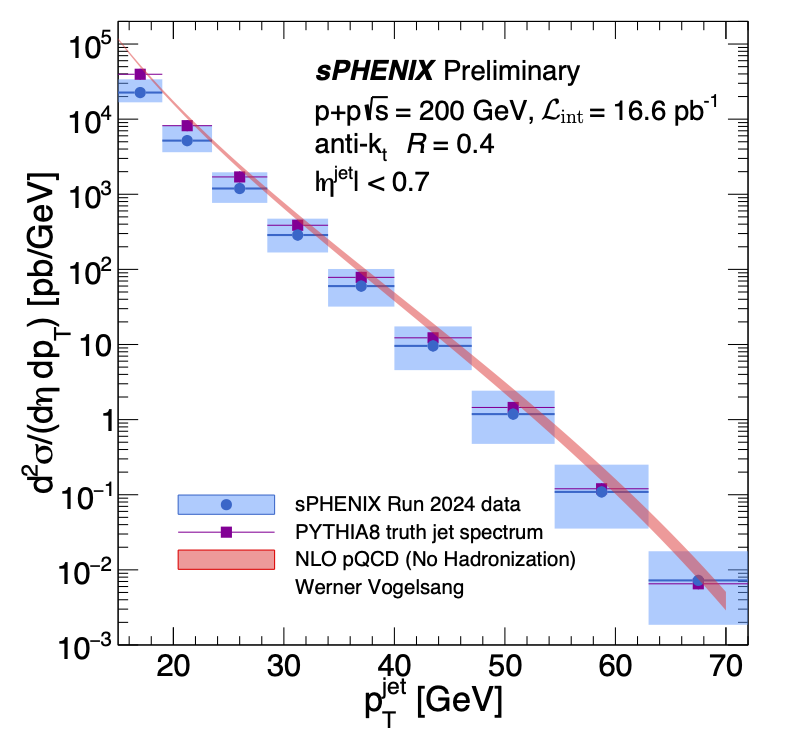
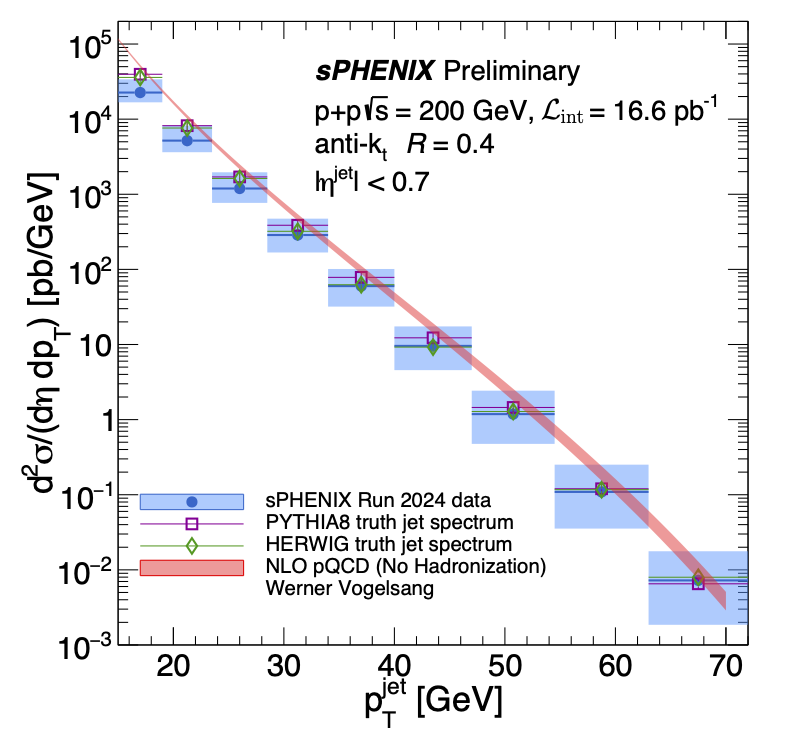
Unfolded jet cross-section for anti-kt R=0.4 jets measured by the sPHENIX full calorimeter system (blue circles), NLO pQCD calculation (red band), and a PYTHIA-8 Detroit-tune truth jet spectrum (purple squares). The blue, vertical bars and shaded boxes represent the statistical and systematic uncertainties, respectively, on the sPHENIX cross-section measurement. The statistical uncertainties are often smaller than the marker size. The NLO pQCD calculation does not include a hadronization step. |
Figure 5 Alternative 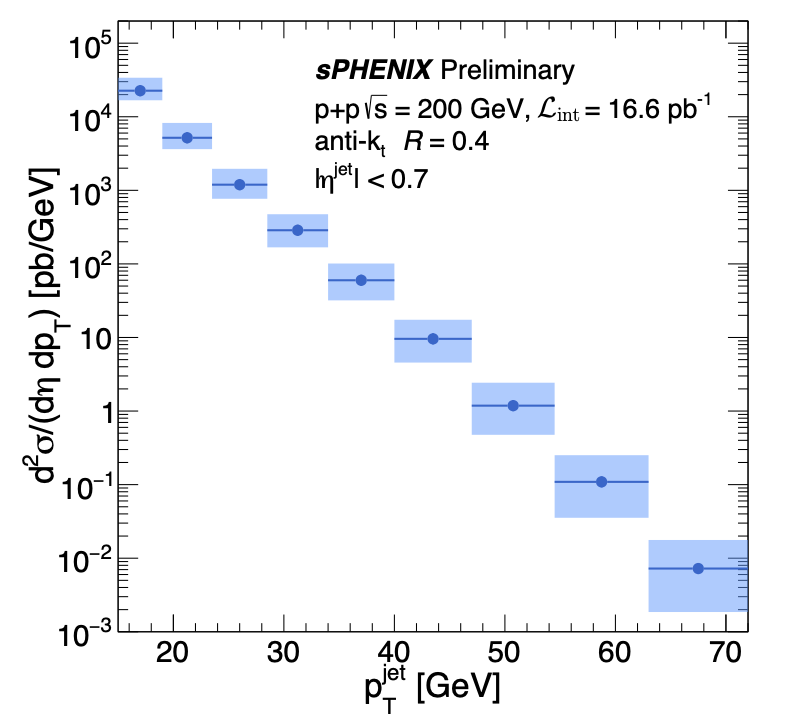
|